
Export data
- Purpose
- Download a table as CSV or Excel, or build a PowerPoint deck from your records.
- Who is this for
- Everyone
- Prerequisites
- For CSV and Excel, a table with the view you want already set up.
- Permissions
- View access to the module. You can only export what you can see.
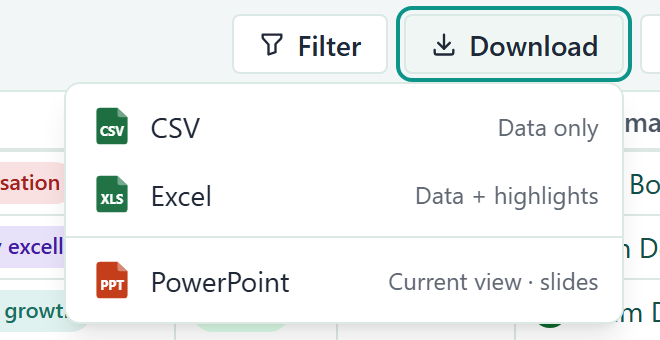
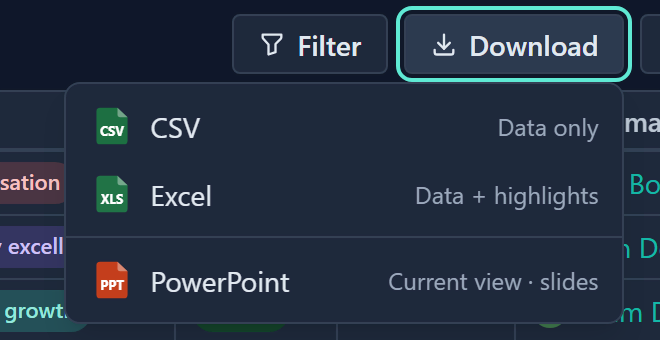
The Download button in a table's toolbar offers three formats. CSV and Excel give you the data to work with elsewhere. PowerPoint builds a presentation from your records.
If an admin switches PPT export off, every PowerPoint item disappears, including Download one-pager. See Turn features on or off.
How it works
A CSV or Excel export mirrors the table on your screen. The file contains the visible columns in their current order and only the rows that pass the current tab's filters and search. Set up the view first, then export.
A PowerPoint deck does not follow the tab on screen. Each Table slide starts from the module's All tab and has its own Filter and Sort. See Build a deck.
| Format | Contains | Menu note |
|---|---|---|
| CSV | The data only, as plain text | Data only |
| Excel | The data, plus your highlight rules as real cell colours and formatting | Data + highlights |
| PowerPoint | A deck of slides you choose and set up in the deck builder | Current view · slides |
Download CSV or Excel
- Open the table and show the columns you want.
- Optional: apply filters or search, and sort.
- Click Download in the toolbar.
- Choose CSV or Excel. The file downloads straight away, with no confirmation message.
If something goes wrong, a "Couldn't export" message appears and no file is saved.
Details about what you get:
- Linked records are written as their names. Several links are joined with a comma. A record you are not allowed to see is written as "Restricted".
- Calculated (formula) columns export their calculated value.
- In Excel, highlights are drawn in the light colour palette, whatever colour scheme you use in Gembaa. Row highlights colour the whole row.
- If a grouped table is exported, the file lists rows flat, without group headings.
- If no rows match, the file contains just the header row.
- On the Milestones table, types left unticked under Visible milestones in the Customise panel are left out of the file, as they are left out of the table.
Build a deck
In the deck builder, choose the slides, put them in order and name the file. If your admin has uploaded a company template, the deck uses it. Otherwise it uses the Gembaa design. See PowerPoint template.
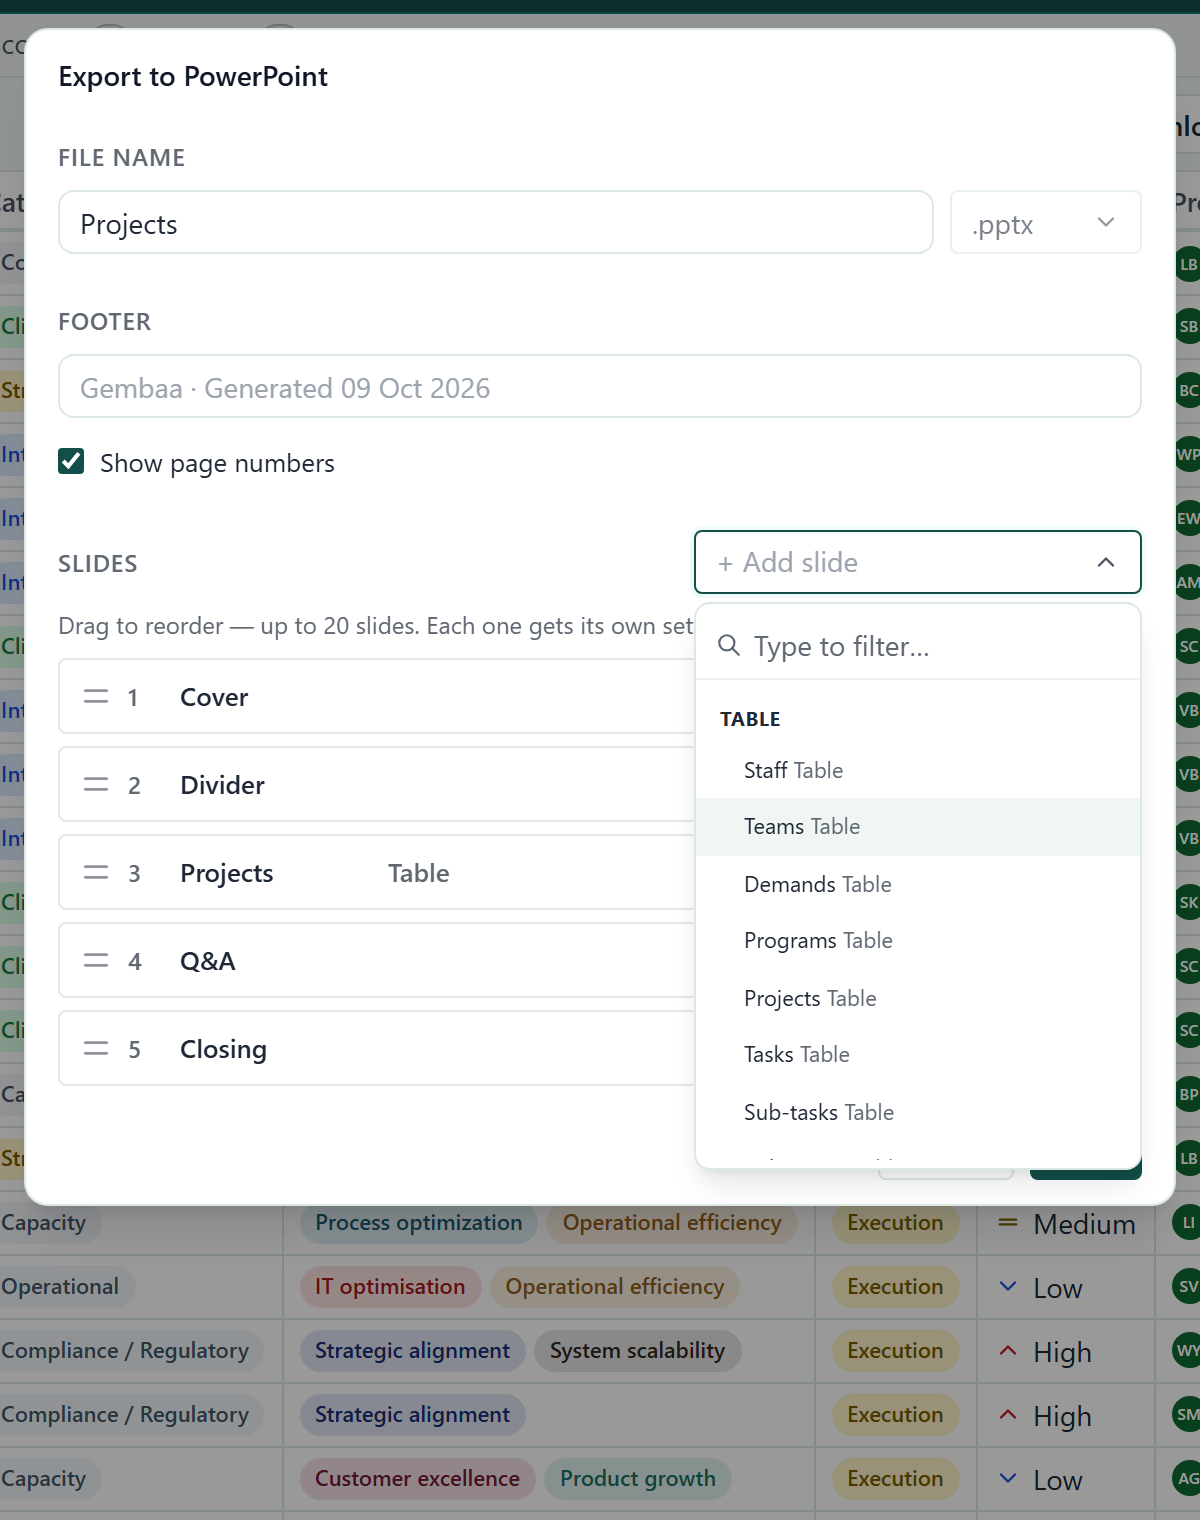
- Click Download and choose PowerPoint. The Export to PowerPoint dialog opens on Slides.
- Enter a File name (up to 80 characters). File format is always .pptx.
- Optional: type a Footer (up to 120 characters). With an empty footer, each slide says "Gembaa · Generated" and the date.
- Optional: choose whether to Show page numbers.
- Under Slides, click Add slide.
- Choose a template. The slide appears in the list.
- Optional: drag slides to reorder them.
- Optional: click Remove slide to drop one.
- Click Next. Each slide has its own page of settings, headed for example "Slide 2 of 4".
- Enter a Slide title (up to 80 characters). Cover, Q&A and Closing slides also take a Subtitle (up to 120 characters).
- Optional: use Back and Next to set the other slides.
- On the last page, click Generate. The dialog closes and the deck starts to build.
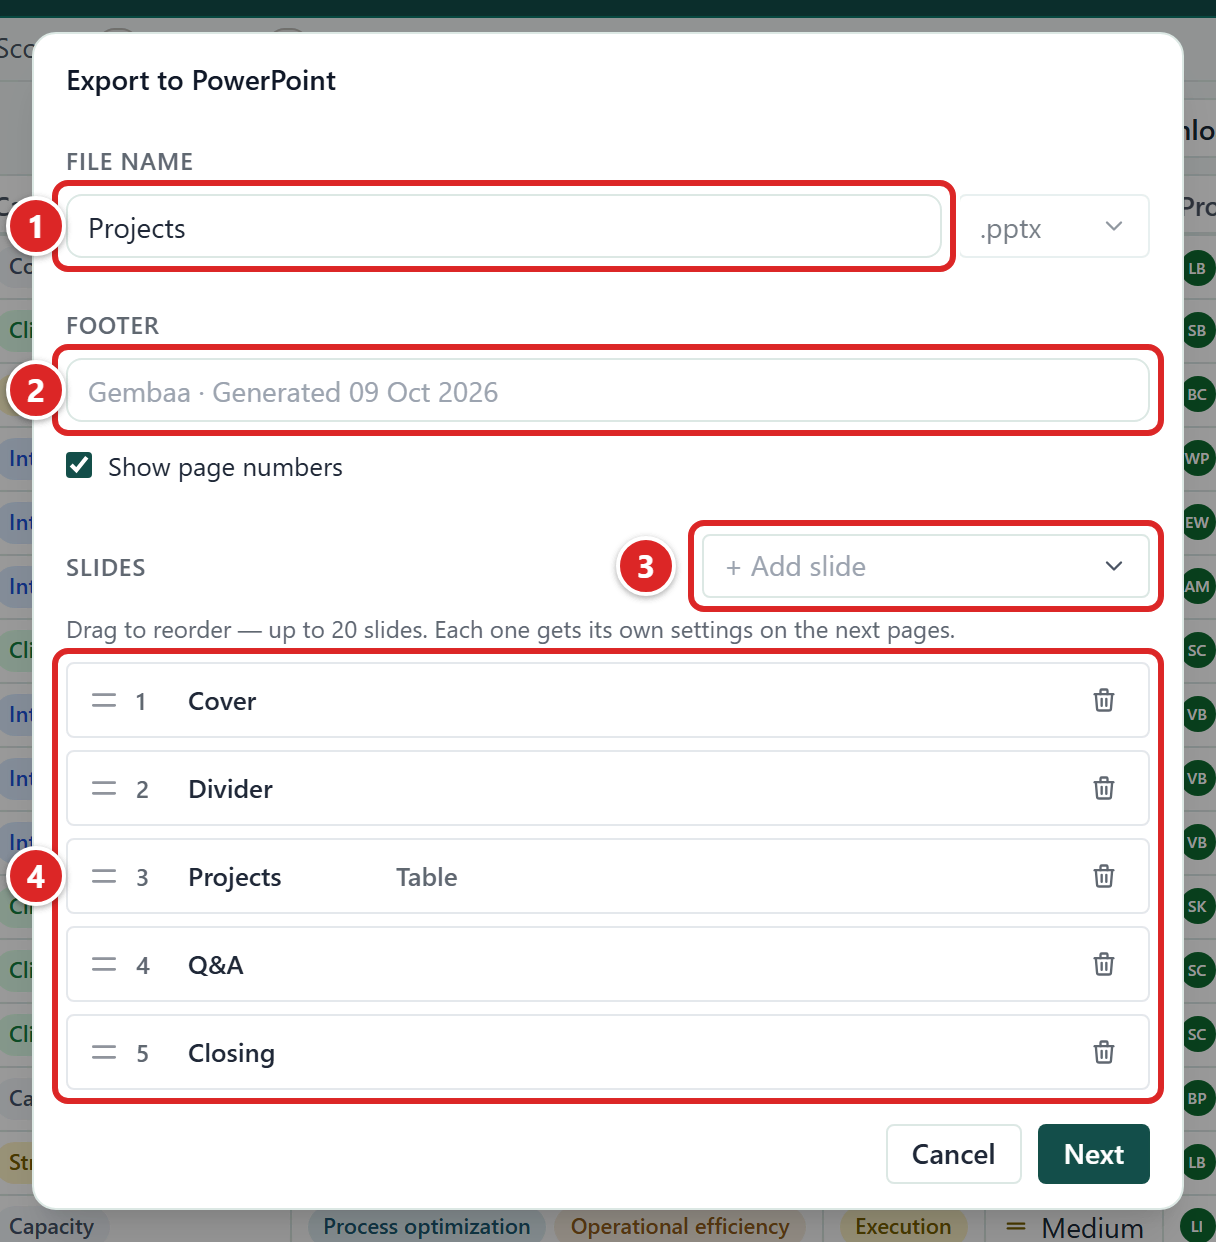
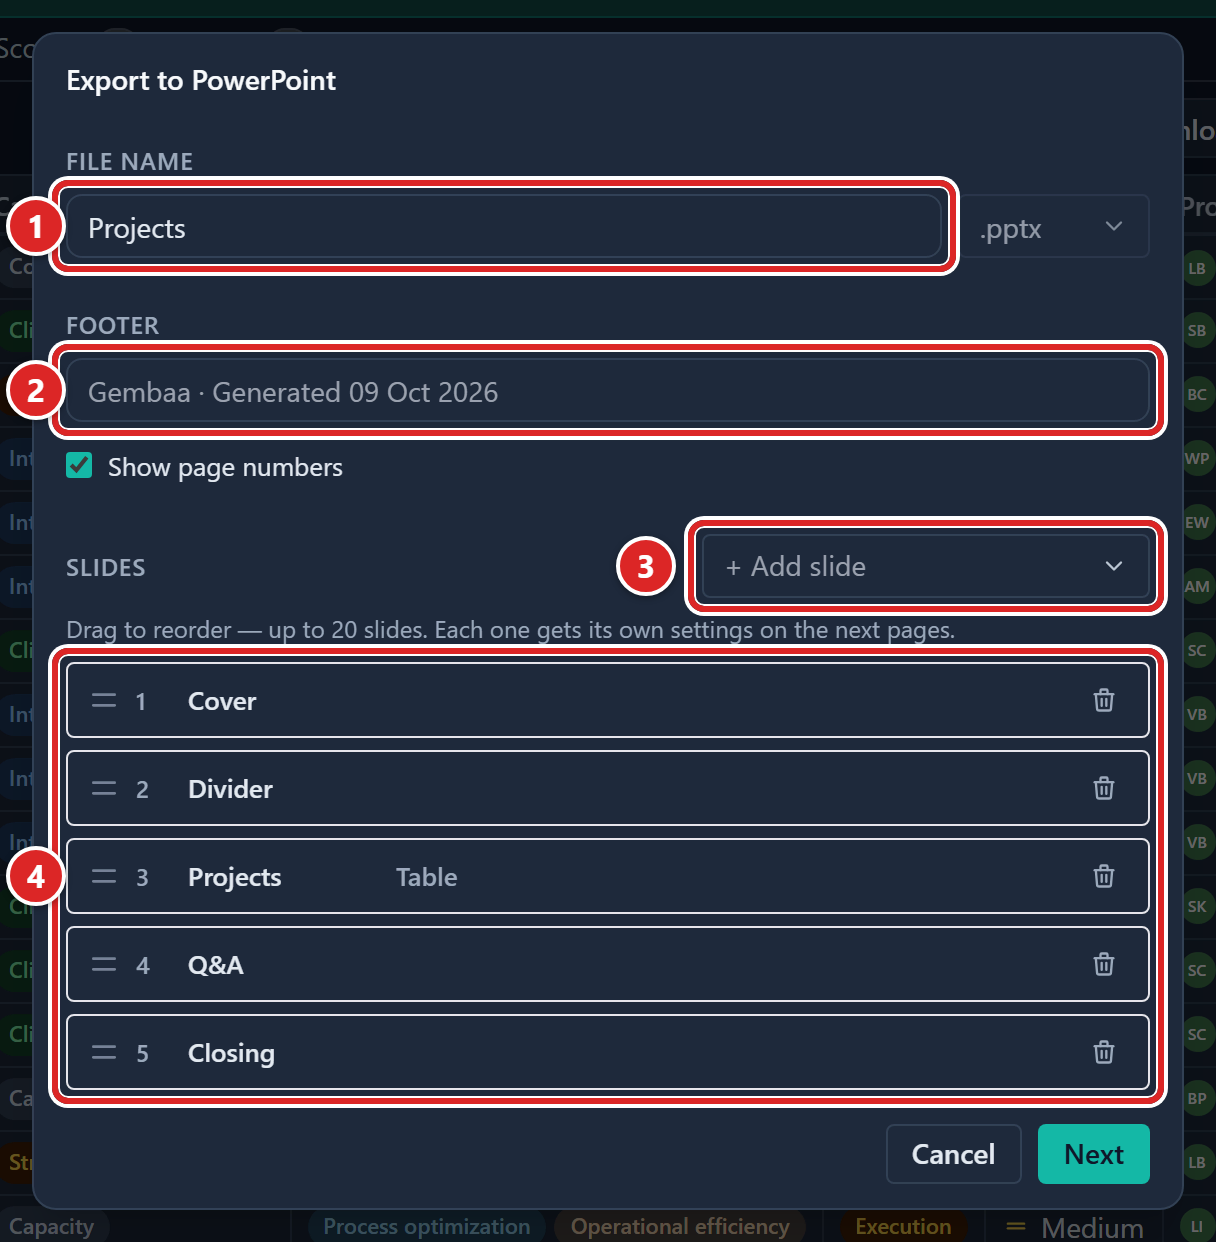
- File name, with the .pptx format beside it.
- Footer. Left empty, it shows the default text with the date.
- Add slide: a list of slide templates.
- The slides in the deck. Drag one to reorder it, or use the bin icon to remove it.
A "Generating PowerPoint…" message shows while you carry on working. When the deck is ready, the file downloads on its own. The message changes to "PowerPoint ready", with a Download button if you need the file again.
If something fails, you see "Couldn't export the PowerPoint" with the reason. Generate again to retry.
If a slide's data does not load, its page shows "Couldn't load this slide's data" with a Retry button. Click it before you generate.
The dialog starts with a ready-made deck for the place you opened it:
- A table starts with Cover, Divider, Table, Q&A and Closing.
- The Pulse page starts with a Pulse matrix slide.
- The Gantt page starts with a Gantt chart slide.
- A record's overflow menu starts with a One-pager.
The next time you open the dialog from the same place, it remembers the deck you used last. A deck holds up to 20 slides.
Default slide titles:
- A content slide takes the module's plural name.
- A Cover takes the file name.
- A Q&A slide says "Questions?" and a Closing slide says "Thank you".
- A Divider takes the name of the slide after it.
Choose a template
| Template | What it makes |
|---|---|
| Cover | A title slide. |
| Divider | A numbered section break, numbered by its position in the deck. |
| Table | Your list, across as many slides as the rows need. |
| Pulse matrix | Health by indicator, for modules that use Pulse. Not offered when Pulse is off. |
| One-pager | One slide per record. |
| Q&A | A "Questions?" break slide. |
| Closing | A final slide. |
| Gantt chart | A timeline of programs, projects, tasks and milestones. Not offered when Gantt is off. |
Mix slides
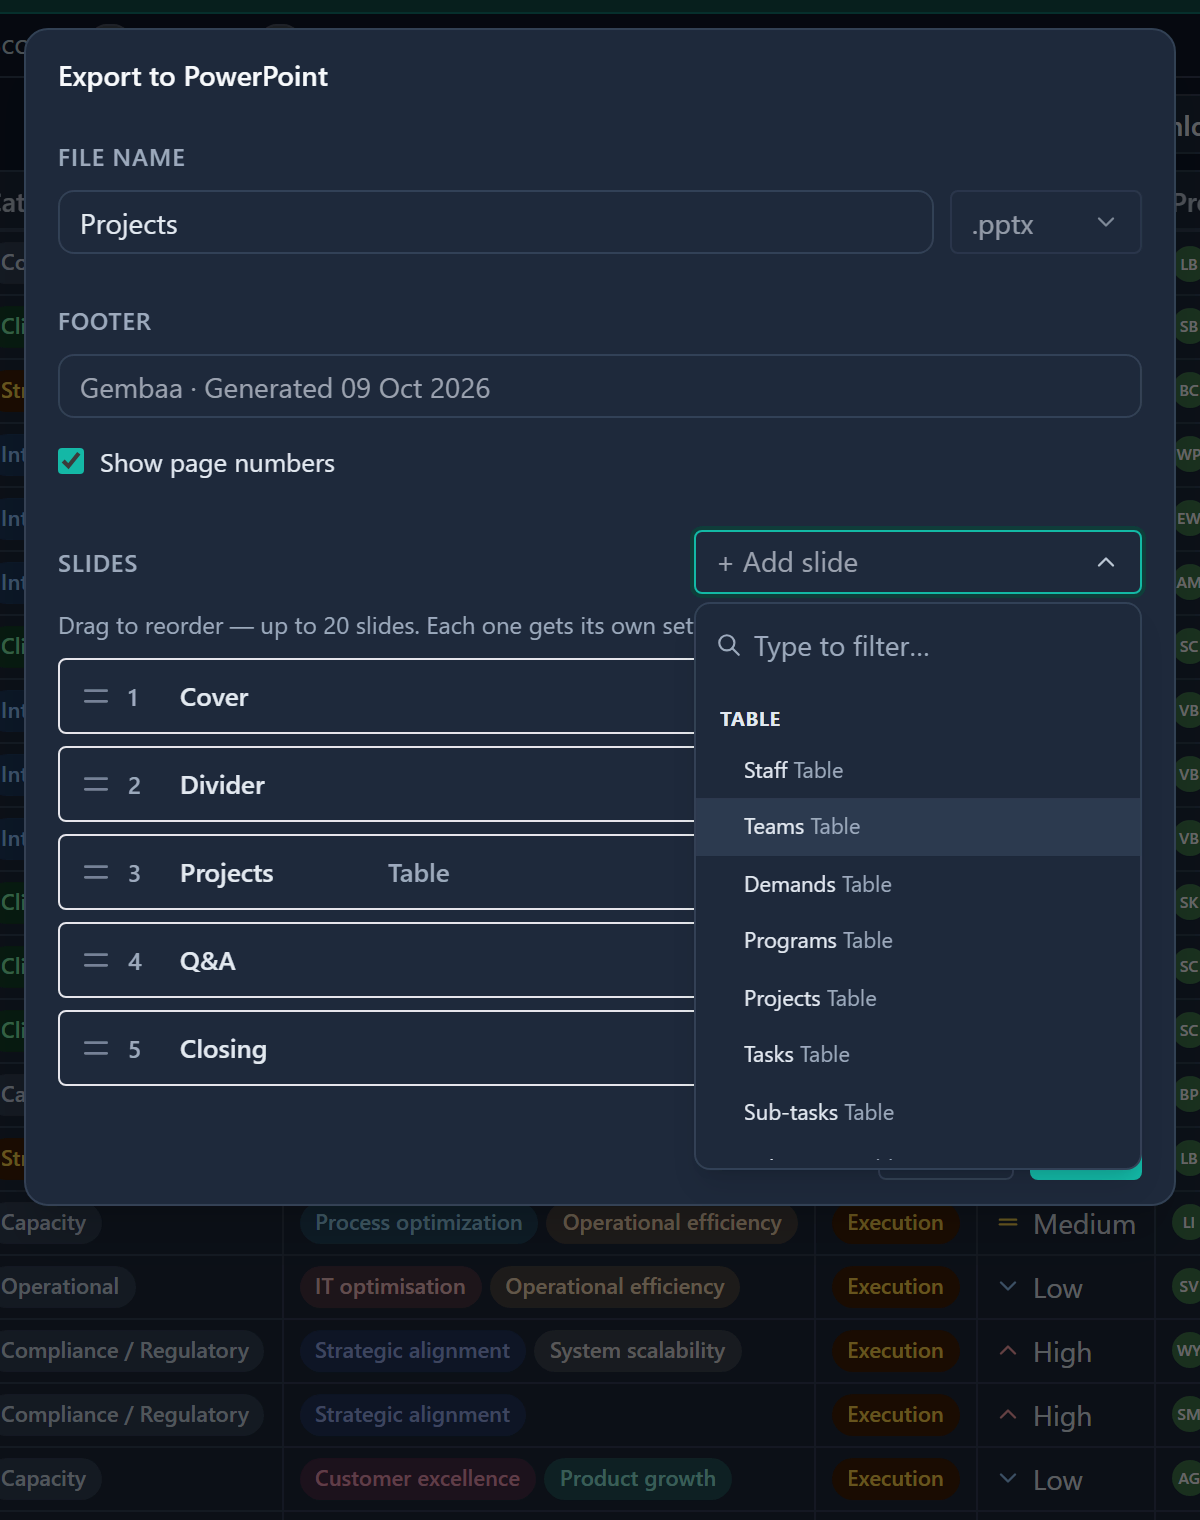
Add slide lists a General group (Cover, Divider, Gantt chart, Q&A and Closing). It then lists Table, Pulse matrix and One-pager once each, with a row for every module you can view. A row shows the module name first, for example "Staff Table".
One deck can mix modules, such as a Projects table followed by a Staff table. Each slide's settings page is headed with its module, with the module and template after the slide count, such as Staff Table.
If no module you can view uses Pulse, the Pulse matrix row is greyed out with the reason "Pulse isn't enabled for any entity you can view".
Set up a Table slide
| Setting | What it does |
|---|---|
| Slide title | The heading of the slide. |
| Columns | Choose up to 10. The columns visible on the module's All tab are ticked to start with. |
| Filter and Sort | Rules just for this slide, using the same filter dialog as the table. The slide starts with every record you can read, not the filters of the tab you were on. The page tells you how many records match, for example "12 of 40 records match". |
| Give space for highlights | Starts the slide's content 200px from the left edge, so you can add your own highlights in PowerPoint. Pulse matrix, One-pager and Gantt chart slides have it too. |
| Include cell highlights | Carries the All tab's highlight colours over to the slide. |
A table slide takes up to 1,000 rows, which flow across extra slides.
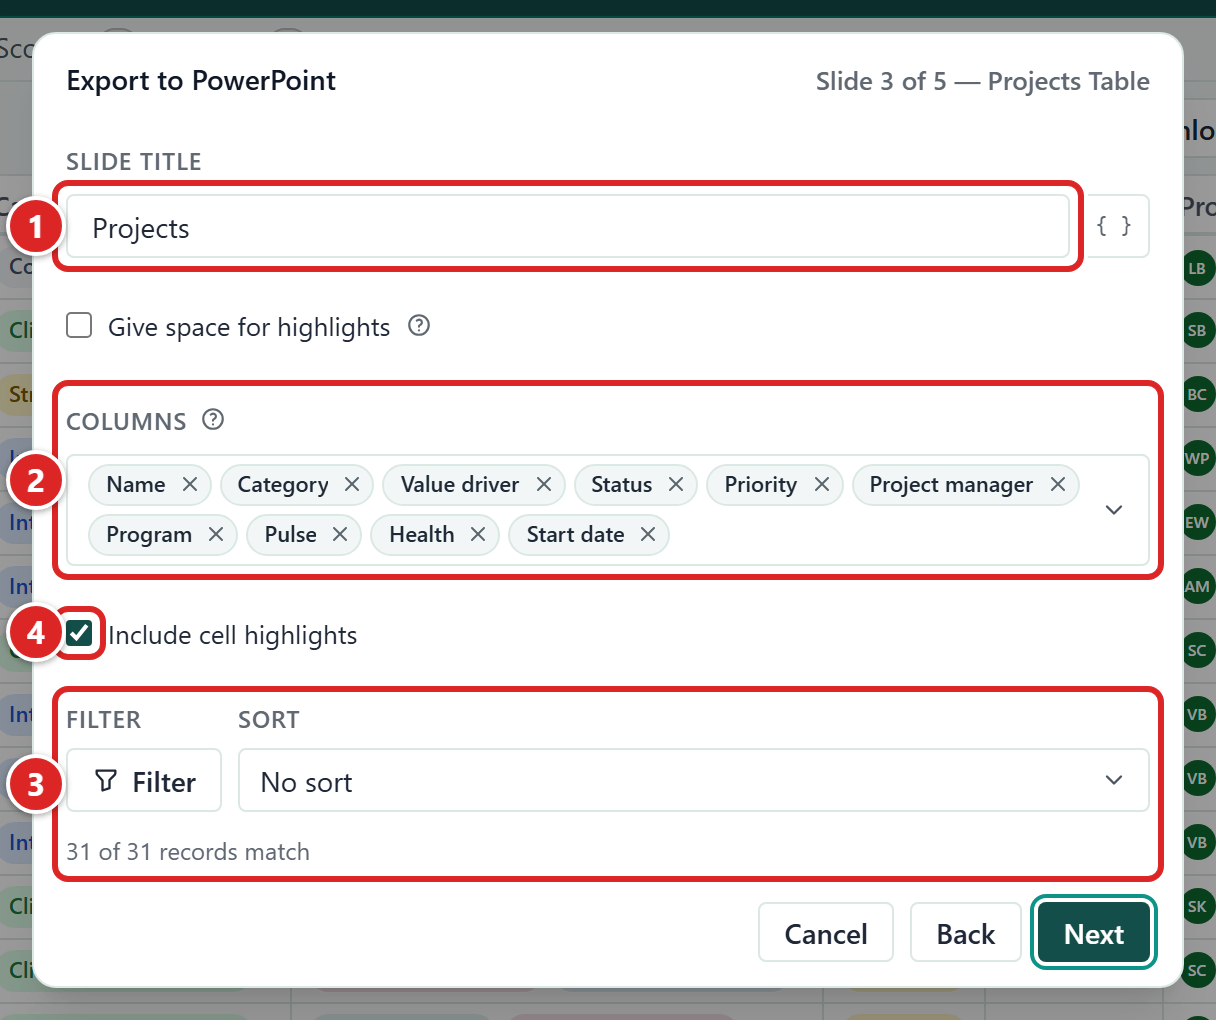
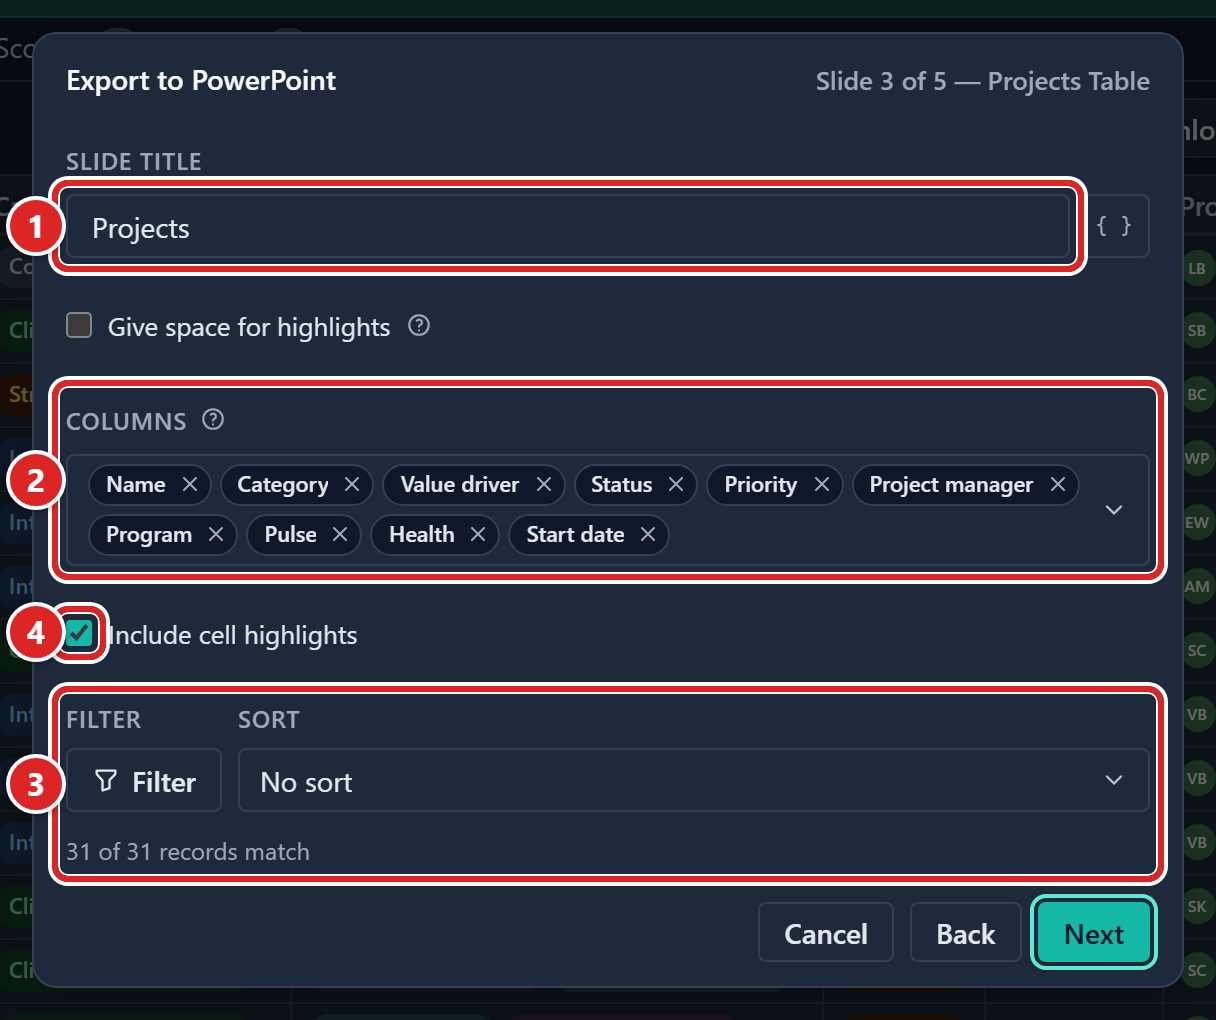
- Slide title.
- Columns, as chips you can remove.
- Filter and Sort, with the count of matching records underneath.
- Include cell highlights.
Set up a Pulse matrix slide
A Pulse matrix slide shows each record's health by indicator. When you open the dialog from the Pulse page, the slide starts from the indicators your tab shows.
| Setting | What it does |
|---|---|
| Slide title | The heading of the slide. |
| Indicators | Choose up to 7. Overall is always included. |
| Show status labels and Show forecast arrows | Both are on to start with. |
| Filter and Sort | Rules just for this slide, as on a Table slide. |
Set up a Gantt chart slide
| Setting | What it does |
|---|---|
| Levels | Tick which of programs, projects, tasks and sub-tasks to include, and Milestones if you want them. Projects and tasks are ticked to start with. If nothing is ticked, you see "Choose at least one level or milestones." |
| Period | All dates, This month, This quarter, This year, Next 3 months, Next 6 months, Next year or Custom. Custom shows Period start and Period end, and you must fill in both. |
| Scale | Weeks, Months, Quarters or Years. |
| Columns | Add Status, Start & end dates or Owner next to the name. |
| Group by | No grouping, or a field of the top level you included. Rows with no value fall under "Ungrouped". |
| Show | Today line, Progress, Milestones on bars, Milestone dates, Date-field milestones, Swimlanes and Legend. |
| Filter | One filter for each level you included. The page shows how many rows the slide will have. |
Set up a One-pager slide
A one-pager summarises a single record on one slide.
| Setting | What it does |
|---|---|
| Field details | Choose up to 8 fields. |
| Also include | Tick Pulse (latest check-in), RAIDD (linked risks, issues, dependencies, assumptions, decisions), Allocation (last 90 days), OKRs (linked objectives) or Knowledge (linked entries). Choose at least one. |
| Top items per zone | How many linked records to list for each of those sections. The default is 5 and the most is 10. The slide shows as many as fit. |
| Records to include | The first 50 records of the module are ticked, whatever tab you were on. Untick any you do not want. A deck holds up to 50 one-pagers in total. |
To make a one-pager for one record, open the record and choose Download one-pager from its overflow menu.
A section you cannot see is left out of the slide. It is never shown as "Restricted" and never leaves a gap.
Export from other pages
Other pages have their own Download menu:
- Gantt: Image (PNG) or Image (SVG) of the chart, CSV or Excel for either all rows or only the visible rows (data only, without highlights), and PowerPoint.
- OKR, RAIDD and Tasks: CSV, Excel and PowerPoint, as described above.
- Allocation: CSV, Excel (numeric hours) and PowerPoint, plus Image (PNG) when a chart is showing.
- Pulse: PowerPoint only.
Good to know
- Exports respect your access. A file or deck never shows more than you can see in Gembaa.
- Everyone who can view a table can export it. No separate permission is needed.
- Hiding a column removes it from the export, so unhide any column you need first.
- Highlights show in Excel and PowerPoint, but not in CSV.
- If the Download menu has no PowerPoint item, an admin has switched PPT export off.