
Allocation
- Purpose
- Plan who works on which project, how much and when, and spot people who are over or under booked.
- Who is this for
- Project and program managers, resource planners
- Prerequisites
- At least one staff member and one project. An admin has set the allocation calendar.
- Permissions
- View access to Allocation to read the grid. Edit access to add, change or delete allocations.
Allocation is where you plan who works on which project, how much and when. An allocation books one staff member on one project, at a rate, for a period. The module compares what people are booked for with what they can work, so you can see who is over-booked or has room.
How it works
An allocation has a staff member, a project, an optional role, a scenario and a rate over a period. Your admin can also add extra fields to it (for example Billable).
Scenarios are separate plans side by side, such as Actual, Forecast and Budget. Actual always exists and is the default. Each scenario is checked against capacity on its own, so Forecast can show an over-booking even when Actual does not. If your workspace has only one scenario, the scenario controls are hidden.
Capacity is how much someone can work. It comes from the working hours on their Finance entry. Where no entry covers a period, the workspace default hours are used. See Staff.
The allocation calendar is set by an admin: hours in a working day, working days per week and per month, and whether bookings are captured by day or by week. This decides the unit you enter a rate in:
| Capture mode | You enter the rate as |
|---|---|
| Daily | hours/day |
| Weekly | days/week |
The unit shows beside the number. Your capture mode sets it, so you do not choose it in the dialog. What you see in the grid is a separate choice, the Display unit in Customise. See Allocation settings.
Open the page
Click Allocation in the left menu. The page shows a grid with groupings down the side and time periods across the top. Each cell holds the booked amount, in the unit you chose. The toolbar and grid have these controls:
| Control | What it does |
|---|---|
| Tabs | Your saved tabs. All is always first and cannot be renamed or deleted. |
| Search box | Narrows rows by what is shown. |
| Date range button | Presets are This week, This month, This quarter, This year, Year to date, Last month, Last quarter, Next 30 days, Next 3 months, Next 6 months, Next year and All dates. Choose Custom to pick your own dates. |
| Expand and collapse buttons | Expand all rows and Collapse all rows open or close every group. The arrow beside them, Expand to a specific level, opens down to one level, such as Level 1. |
| Today | Scrolls the columns to the current date. It does not change the date range. |
| Filter, Download, Customise | Filter the grid, export it, and change how it is shown. |
| Add allocation | Opens the dialog that books someone on a project. |
| Grid | Groupings down the side, time periods across the top. |
| Scenario label | Names the scenario the figures come from, for example Actual. |
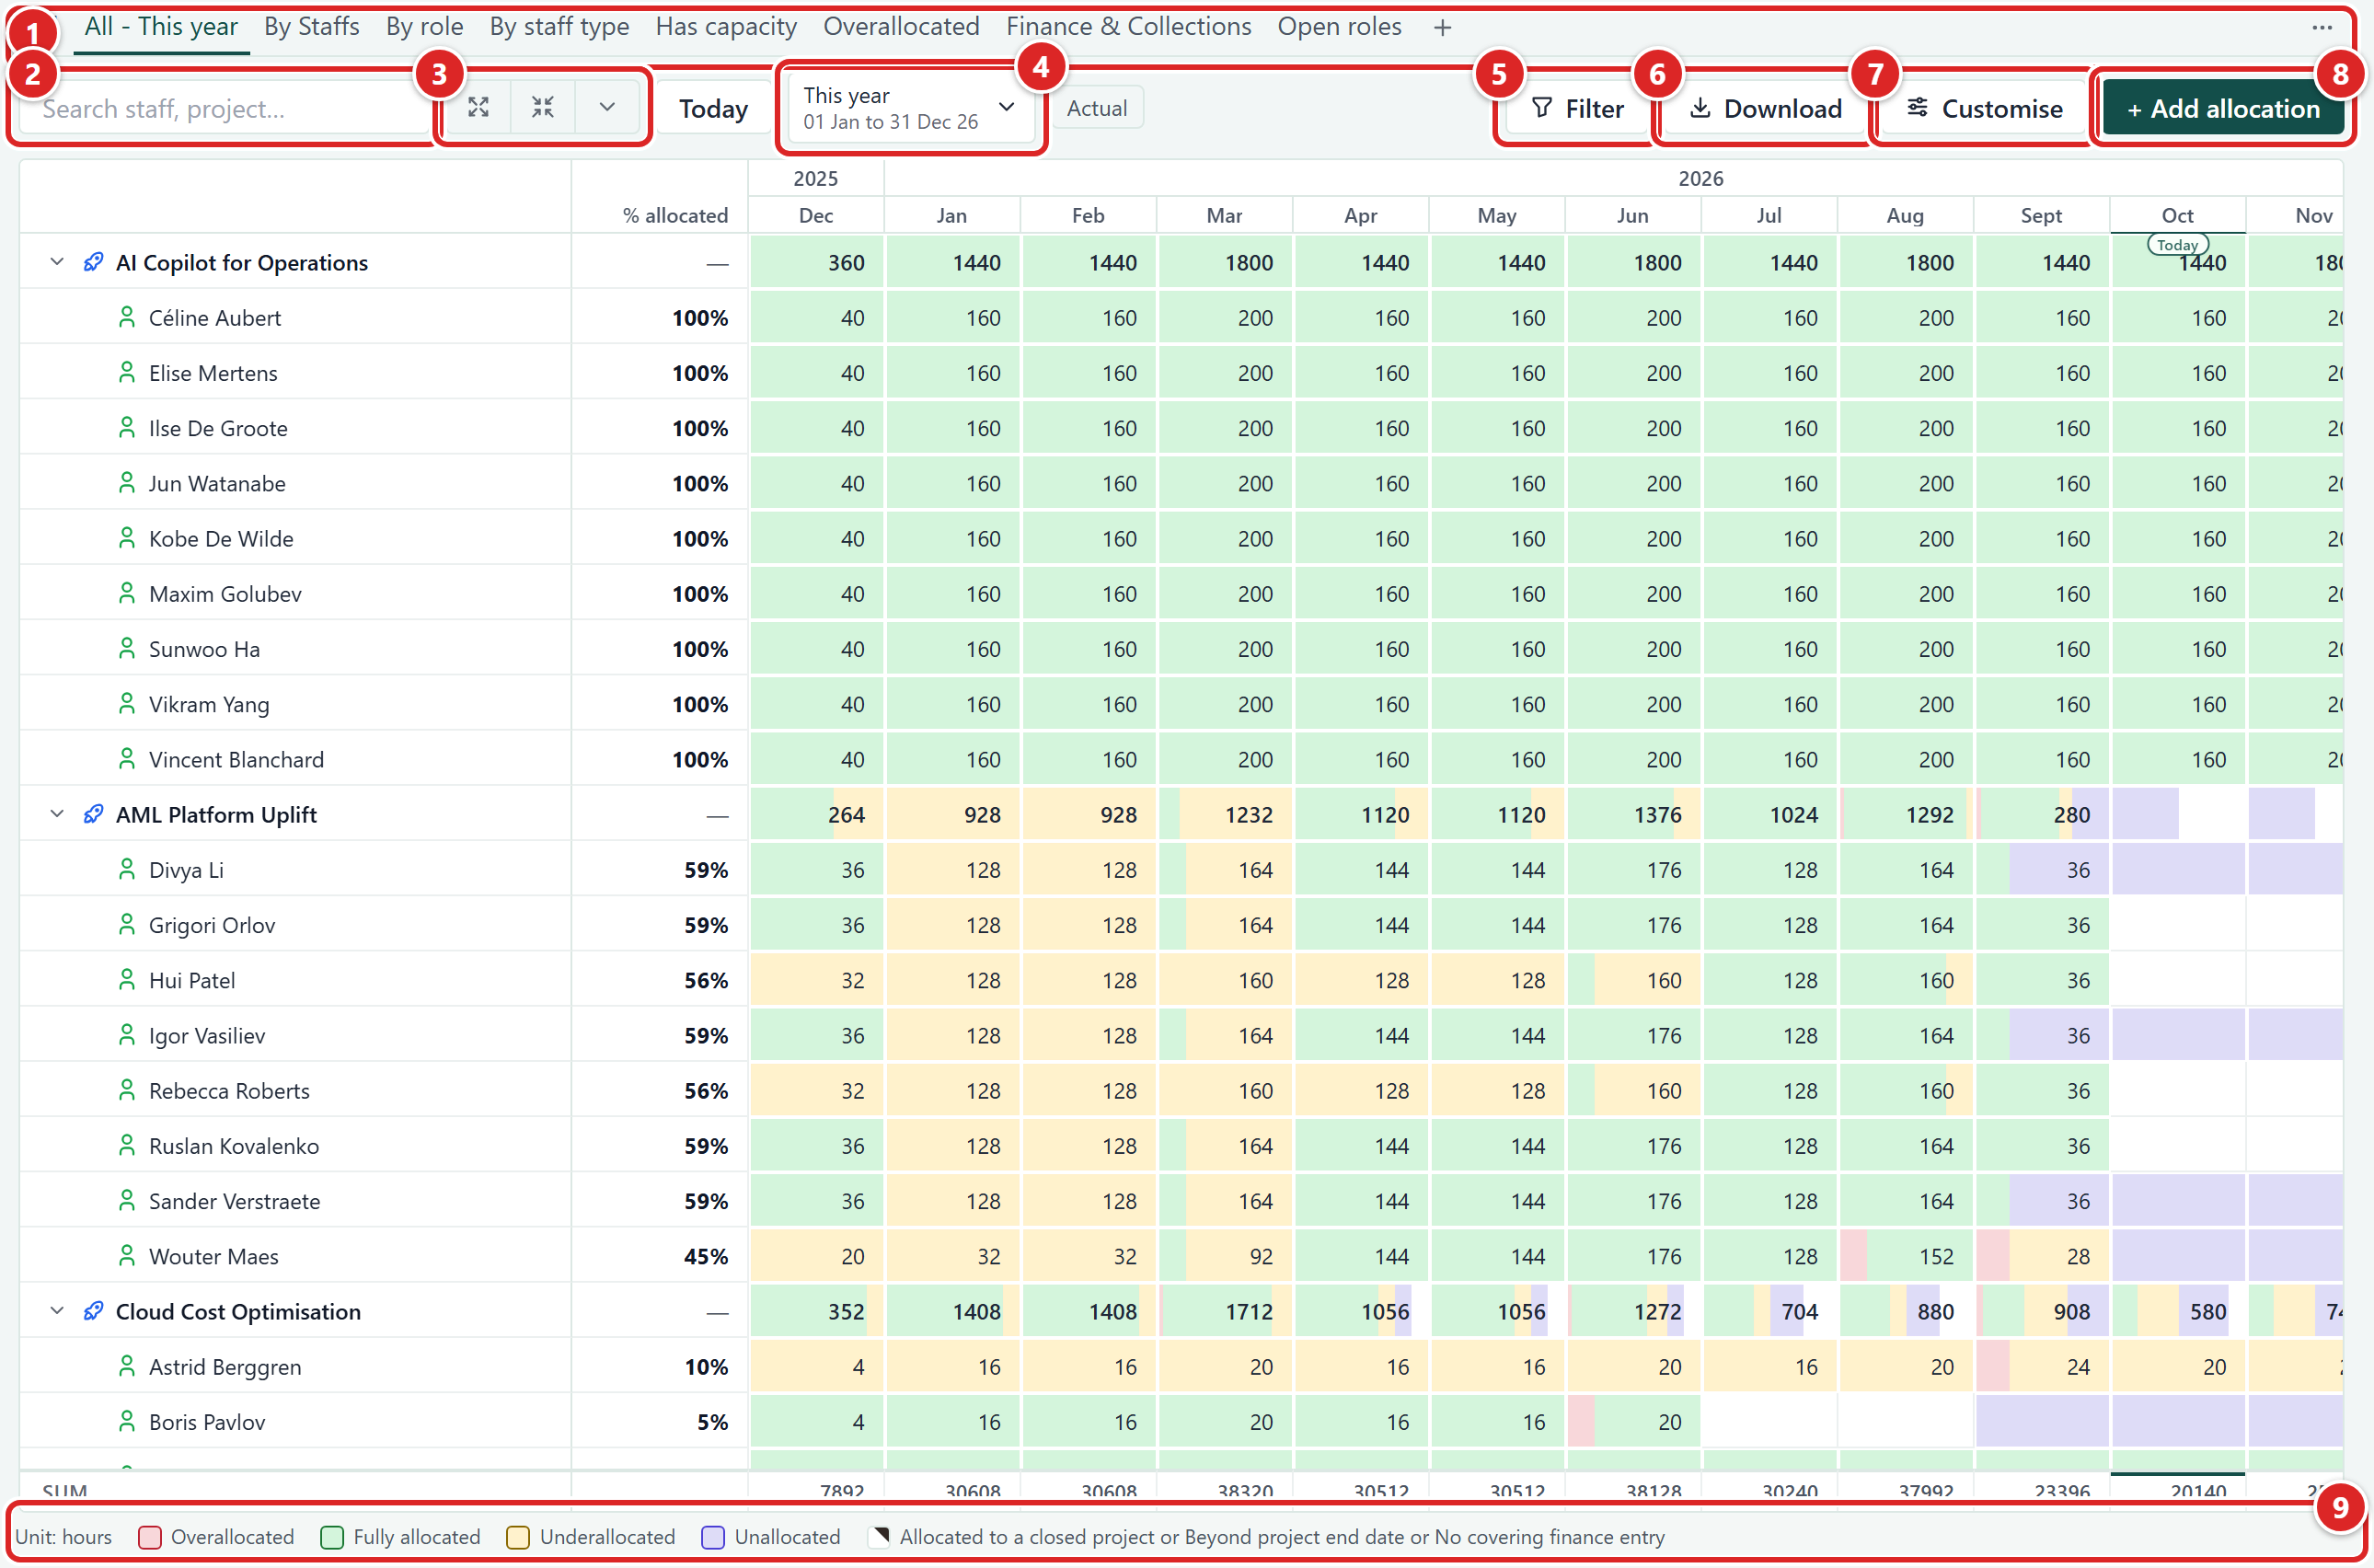
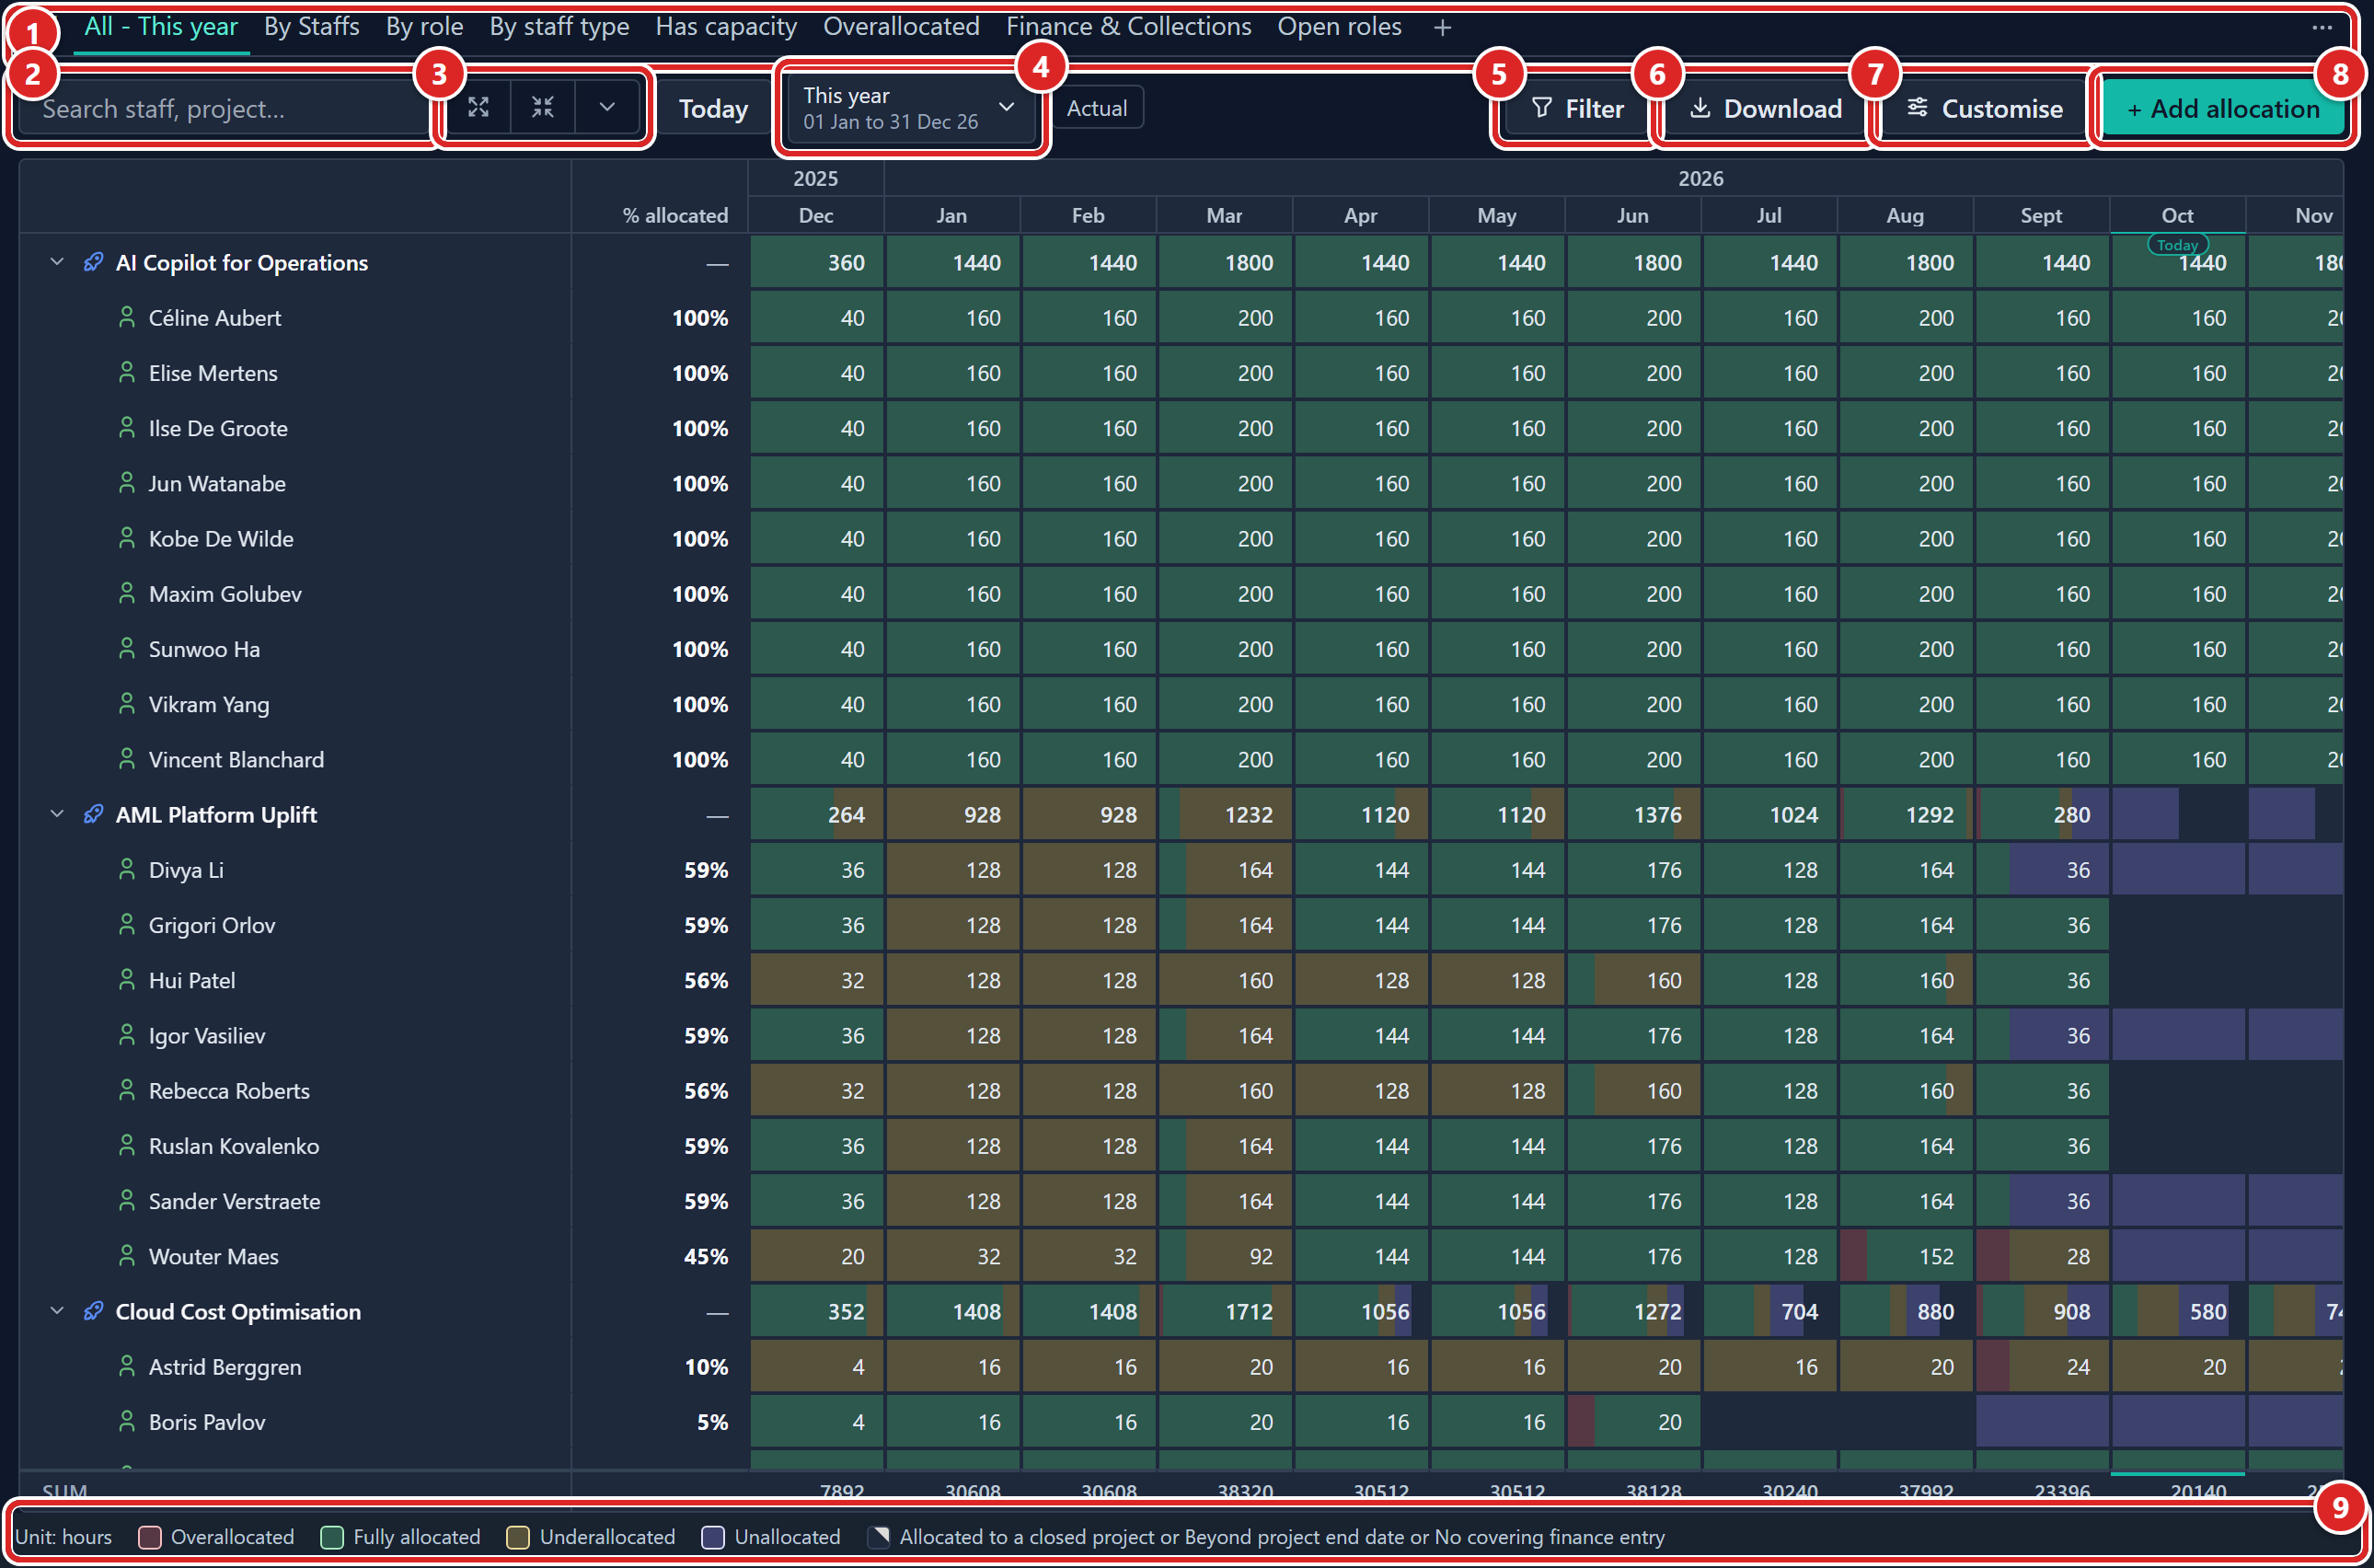
- The tabs.
- The search box.
- The expand and collapse buttons.
- The date range button. The Today button sits beside it.
- Filter.
- Download.
- Customise.
- Add allocation.
- The legend, which explains the cell colours and the corner marks.
Click a staff or project name to open its record panel.
Use the record tab
The Allocation tab on a Staff, Team, Project or Program record shows that record's own allocation as a chart and a list. It has its own Add allocation button. The tab also has:
- A period to look at: 1 month, 3 months, 6 months, 1 year or all time.
- Group by: Staff, Project, Team, Program or None.
- A search box, "Search staff, project…".
- View details, which shows the allocations behind a group, and a Total.
With no allocations yet, the tab reads "No allocations yet, add them from the Allocation module" in place of the chart. After you add some, a message reads "Added 1 allocation" or "Added 3 allocations".
Choose a view
Open Customise and use the Visualisation setting to switch between:
| Visualisation | Use it for |
|---|---|
| Table | The default grid. Rows are grouped, columns are time periods. |
| Pivot table | Full control over rows, columns and values. |
| List | One row per allocation. The place to edit allocations one by one. |
| Bar chart, Stacked bar, Line chart, Area chart, 100% stacked bar, 100% stacked area, Pie chart, Radar (line), Radar (area), Treemap | Charts of the same data. |
Everything you set is saved on the current tab.
Build a pivot table
Use a pivot table when the standard grouping is not enough, for example to put Project down the side and Scenario across the top.
- Open Customise.
- Set Visualisation to Pivot table. The Data tab now shows three lists: Rows, Columns and Values.
- In Rows, choose a field from Add field. It joins the list. Repeat to nest further levels.
- In Columns, choose a field from Add field the same way. Pick the time field here to put periods across the top.
- In Values, choose a measure from Add value. The measures are grouped under Units and Bandwidth (available).
- Optional: to reorder a field or value, drag it by its handle.
- Optional: to drop a field or value, click its Remove button.
To fine-tune a row or column field, open it with Configure (the arrow beside its name):
| Setting | What it does |
|---|---|
| Order | Ascending or Descending. |
| Sort by | Its own label, or one of your values, to rank by the numbers. |
| Show totals | Adds a subtotal for that level. The last level is greyed out, because it has nothing beneath it to total. |
| Time granularity | On the time field only: Day, Week, Month, Quarter or Year. |
Each value has two more settings:
| Setting | What it does |
|---|---|
| Summarise by | How the cell adds up the allocations in it. |
| Show as | Default, % of row, % of column or % of grand total. |
To merge values that use the same unit, switch on Combine values sharing a unit and pick a Combined function. The switch is unavailable, with the note "No two values share a unit.", until two values do.
Set grouping, time and unit
In Customise, on the Data tab:
| Setting | What it does |
|---|---|
| Group by (rows) | Groups by Staff, Team, Project, Program, Role, Scenario, or any of their fields or your extra allocation fields. Nest up to three levels. Upper levels add up the levels below. With no grouping, rows are Staff, then Project. |
| Time dimension (columns) | Day, Week, Month, Quarter or Year. In a pivot table this is the Time period field. You cannot go finer than the capture mode, so a weekly workspace starts at Week. |
| Display unit | Hours, Days, FTE or Cost. Days are hours divided by the hours in a working day. FTE is hours divided by a full-time week, so 1.0 is full time. Cost uses the person's hourly cost from Finance. |
| Rounding and Precision | Decimal places, and K or M for large cost totals. Auto picks sensible values for the unit. |
| Scenario placement | Single (one at a time), Inline A / B (two side by side in each cell), Sub-columns or Sub-rows. Use Compare to see the Difference between two scenarios. |
| Column aggregation | One figure under each period column. See Aggregate columns and rows. |
| Row aggregation | One figure at the end of each row, in its own column. See Aggregate columns and rows. |
| Pinned columns | Keep fields such as Department visible beside the row labels. An admin sets how many, from 1 to 5. See Allocation settings. |
| Show weekend marker, Show today marker, Show legend | Turn those aids on and off. |
| Days shown | Appears when the time period is Day. It picks which weekdays become columns. A dot marks your company weekend. |
| Trailing column | Pivot table only. Adds a last column that shows a field of a linked record. Shows is None or Linked record field. The section appears only when a row level is a record such as Staff or Project. |
| Scenarios compared, Baseline (A), Compare with (B) | Appear when you compare scenarios. Scenario shown appears when you view a single one. |
| Axes | For charts: X axis and Series (colour). The Y axis is the measure, set under Display unit. |
| Legend | Its Position: Below, Above, Left of or Right of the chart, aligned Left, Centre or Right (Top, Middle or Bottom at the sides). |
Click Suggested for quick starts such as Staff × Month, Project × Scenario or Program › Project.
Aggregate columns and rows
An aggregation is one figure that sums up a line of cells. Column aggregation adds a row under the grid, with one figure for each period column. Row aggregation adds a column, with one figure for each row. A small grid icon beside each setting shows which direction it works in.
- Open Customise and go to the Data tab.
- Under Column aggregation, choose a function. The footer row under the grid shows it.
- Under Row aggregation, choose a function. The extra column appears.
- Optional: to move the column, use the On the left and On the right buttons beside Row aggregation. They appear while it is not Off, and the column starts on the left.
The two settings offer the same functions, with two differences: Auto and % allocated belong to Row aggregation only.
| Function | What it shows |
|---|---|
| Off | No aggregation. |
| Auto | Row aggregation only. Each value uses its own Summarise by function. |
| Sum, Average, Min, Max | The total, mean, lowest or highest figure in the line. |
| Count | How many cells are in the line, empty ones included. |
| Count non-empty | How many cells hold a value. |
| Median | The middle figure in the line. |
| % of grand total | The line's share of the whole grid, to one decimal place. |
| % allocated | Row aggregation only. Booked time as a share of the person's capacity. |
| Bandwidth available | Capacity left after bookings. |
| Bandwidth available % | Capacity left, as a share of capacity. |
The Table starts with Sum under the columns and % allocated on the rows. The pivot table starts with Sum and Auto. The List starts with both Off. The charts have neither setting.
The header and the footer name the function, such as Sum or Max, never "Total". With Auto, the header shows the function the values share, or Aggregation when they differ.
Hover over any aggregation cell to see how it was worked out. The tip names the direction, gives the figure and says what it covers, for example "Max of 25 projects". Some functions add a note, such as how many cells had a value and that empty ones are left out. The corner cell where the two aggregations meet shows no figure. Its tip gives the answer for each direction.
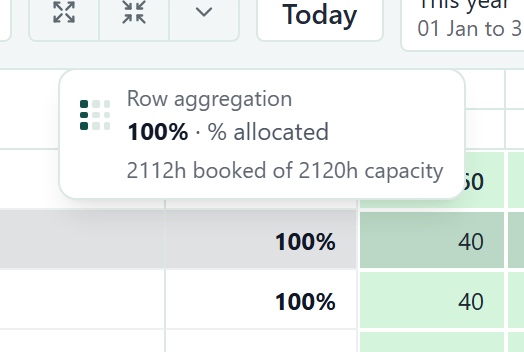
If the List shows several scenarios, the footer counts the first scenario shown. The tip lists each scenario, and the first is marked "shown in the footer".
Plan around unallocatable people
An admin can turn allocation off for a person, and a deactivated person cannot be allocated either. See Staff for how to turn it off or on. For these people:
- Their row stays on the Allocation page with an Allocation disabled badge. Hover over it to see the date.
- They have no capacity. They are left out of capacity totals and free time, get no (Unallocated) row and are never flagged as over-allocated.
- A quick search that matches them shows a notice naming them. If a search or filter leaves only such people, the empty state reads "Allocation is disabled for (name)".
- The row menu, the bulk Add allocation and the List Duplicate explain why instead of opening the Add dialog.
- Their past allocations stay. You can delete them, but not change them.
Spot over and under-allocation
The grid colours cells against each person's capacity for that period. By default:
- Overallocated: booked more than capacity.
- Fully allocated: booked exactly their capacity.
- Underallocated: booked less than capacity.
Hover over a cell to see the allocations in it, what the person has left, and their other bookings in that period.
The cell's row is highlighted too. For a cell in a period column, the column is highlighted as well, down to its aggregation at the foot. In the List, the hovered cell's row and its period column are highlighted.
This works in the Table, Pivot table and List, empty cells included. The highlight clears when the pointer leaves the grid.
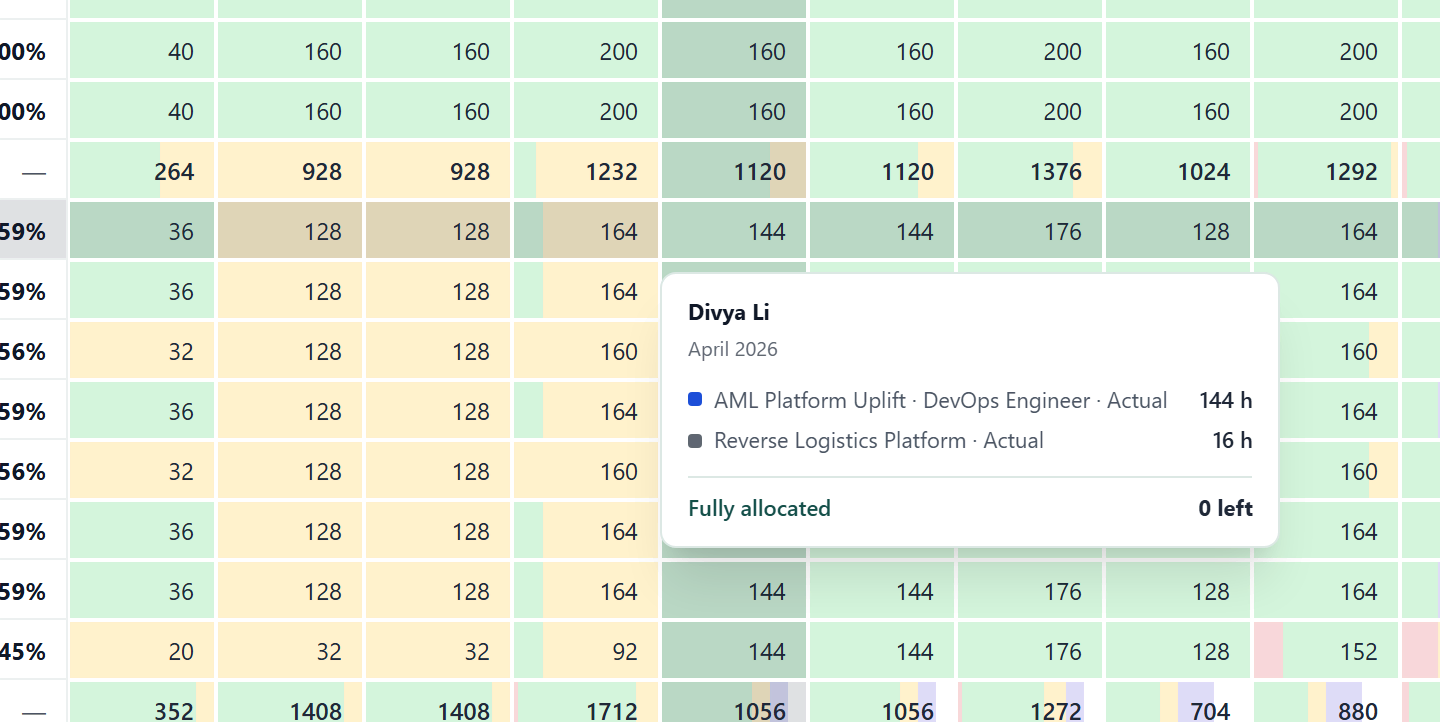
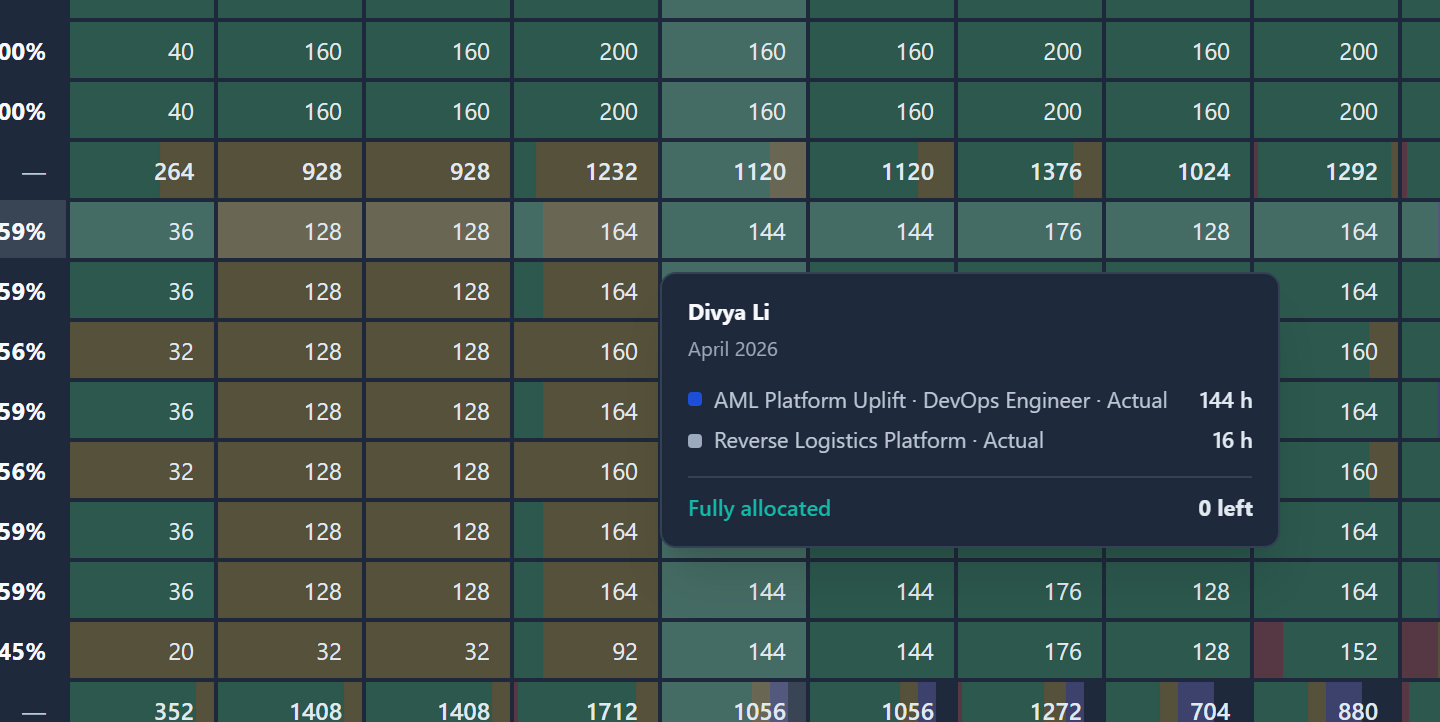
If a period contains days in different states, the cell shows coloured bands in proportion to the working time of each.
Highlights colour period cells only. The aggregation column, the footer row and the corner cell are never coloured.
To change what is flagged, open the Highlights tab of Customise. What the tab shows depends on the Visualisation.
Table, List and charts
The tab has three dropdowns, one for each channel: Background, Corner indicator and Colored icon. Each takes None, Capacity, Data-quality or Metadata. To start, Background is Capacity, Corner indicator is Data-quality and Colored icon is None.
- Capacity flags over, full and under-booked cells.
- Data-quality flags bookings that look wrong. Choose it on any channel and a Data-quality checks section appears.
- Metadata colours by a field. Choose it on any channel and a Metadata section appears with a Color by dropdown (None, Scenario, Role or a choice field you added to allocations).
The Data-quality checks are switches. They flag bookings without blocking them:
- Allocated to a closed project
- Beyond project end date
- No covering finance entry, shown only while Finance is switched on.
Pivot table highlights
When Visualisation is Pivot table, each channel holds a list of rules instead, such as "value is over capacity". The Corner indicator shows one mark, so it holds one rule.
- Under a channel, click Apply preset….
- Choose Capacity, Data-quality or Metadata. The channel fills with a ready-made set of rules.
Then edit, reorder or delete the rules. To change a rule, choose its Rule type:
| Rule type | What it does |
|---|---|
| Value comparison | Compares the cell's value with capacity or a number, using an operator: is over, is at least, is under, is at most, equals, does not equal or is unallocated. |
| Data quality | Flags the cell when any of the checks you tick holds (the same three checks as above). |
| Color by dimension | Colours by a Dimension, such as a field of the row. |
| Linked record field | Uses a field on a linked record. |
Add an allocation
- Click Add allocation. The dialog opens.
- Choose the Staff and the Project. If you started from a record or a cell, these are already filled in.
- Optional: choose a Role. (no role) is allowed.
- Choose the Scenario. It defaults to Actual.
- Enter the Allocation. The unit beside it (hours/day or days/week) follows your capture mode. A line under the rate shows the result, for example "8 h per day" or "40 h per week".
- Set Period start and Period end.
- If your workspace captures by day, tick the weekdays under Days that should get the hours. Days that are not working days are marked. At least one day is required.
- Optional: fill in any extra fields.
- Click Add. The allocation appears in the grid.
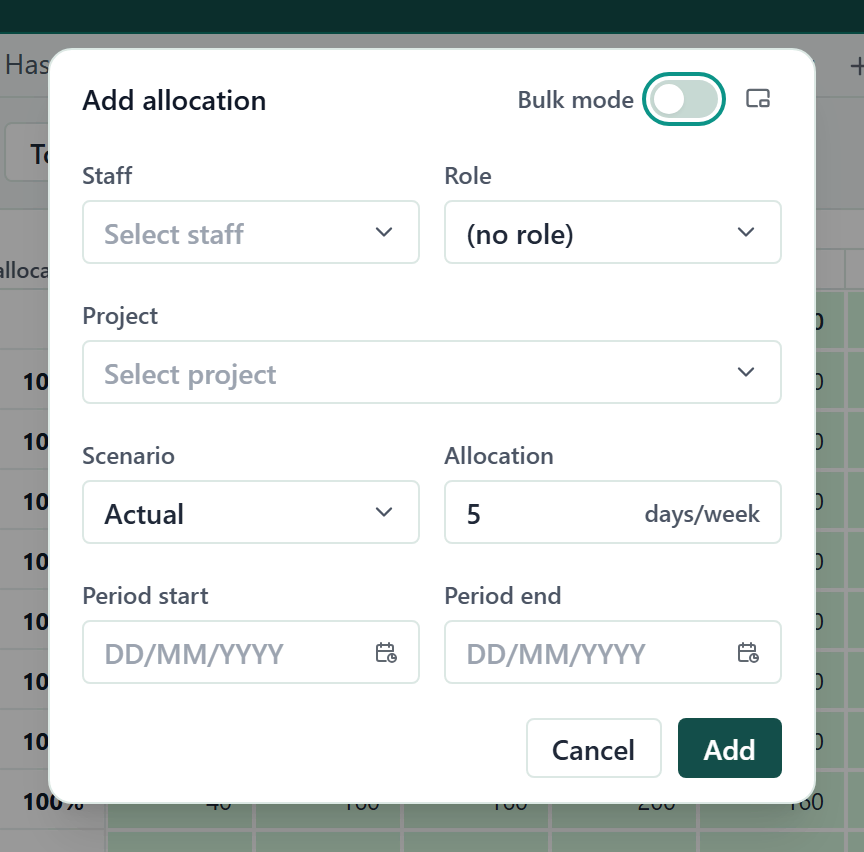
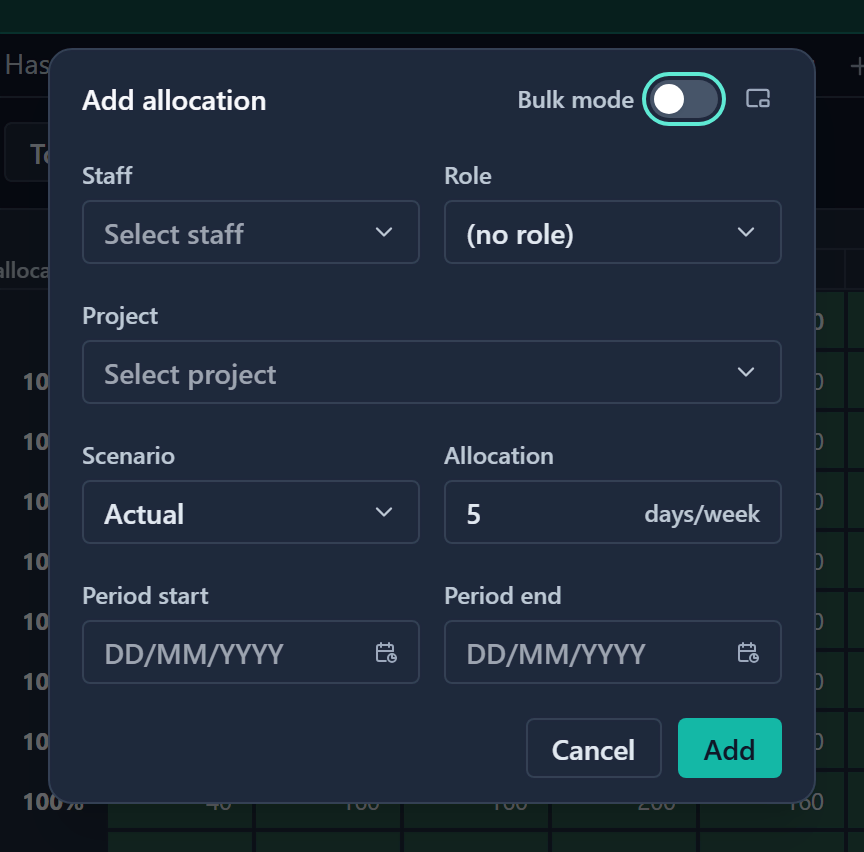
People who cannot be allocated are listed greyed out, tagged Allocation disabled or Deactivated.
Two other routes open the same dialog: right-click a row label in the grid and choose Add allocation…, or choose Add allocation from the record menu of a Staff or Project record.
The dialog can be docked to the bottom-right corner or minimised to a bar, so you can keep the grid in view while you fill it in.
If you book hours on a project in a closed status, Gembaa asks you to confirm with Book anyway.
If an allocation with the same staff, project, role, scenario and extra fields already exists, the hours are added to it.
Add several
- In the Add dialog, switch on Bulk mode at the top. The dialog shows a table with one row per allocation.
- Fill in the first row.
- Click Add another row to add more. Use Duplicate row to copy one and Remove row to drop it.
- Click Add to create them all.
Edit an allocation
Edit a day or week
- On the List or Table, double-click a cell that holds a single allocation for a single day or week.
- Type the new value and press Enter. The cell shows the new value.
A cell that adds up several allocations or several days is read-only, and a message tells you to drill down. Open the List to edit the allocations one by one.
Edit role and other fields
- In the List, double-click the value in the row.
- Pick a new one.
- If the change makes the allocation identical to one that exists, you are asked to Merge them. Click Merge.
Edit many cells
Select cells in the grid, then use the bar that appears. To select:
- Click a cell, or drag over a range.
- Hold Shift and click to extend the range.
- Hold Ctrl (or Cmd) and click or drag to add another range.
- Right-click a row label and choose Select row to select the whole row. Edit values… in the same menu selects the row and opens the edit grid.
With the keyboard, move to a cell with the arrow keys and press Space or Enter to select it. Hold Shift with an arrow key to extend the selection. Press Esc to clear it. These keys work in the Table and the List. See Keyboard shortcuts for every key in Gembaa.
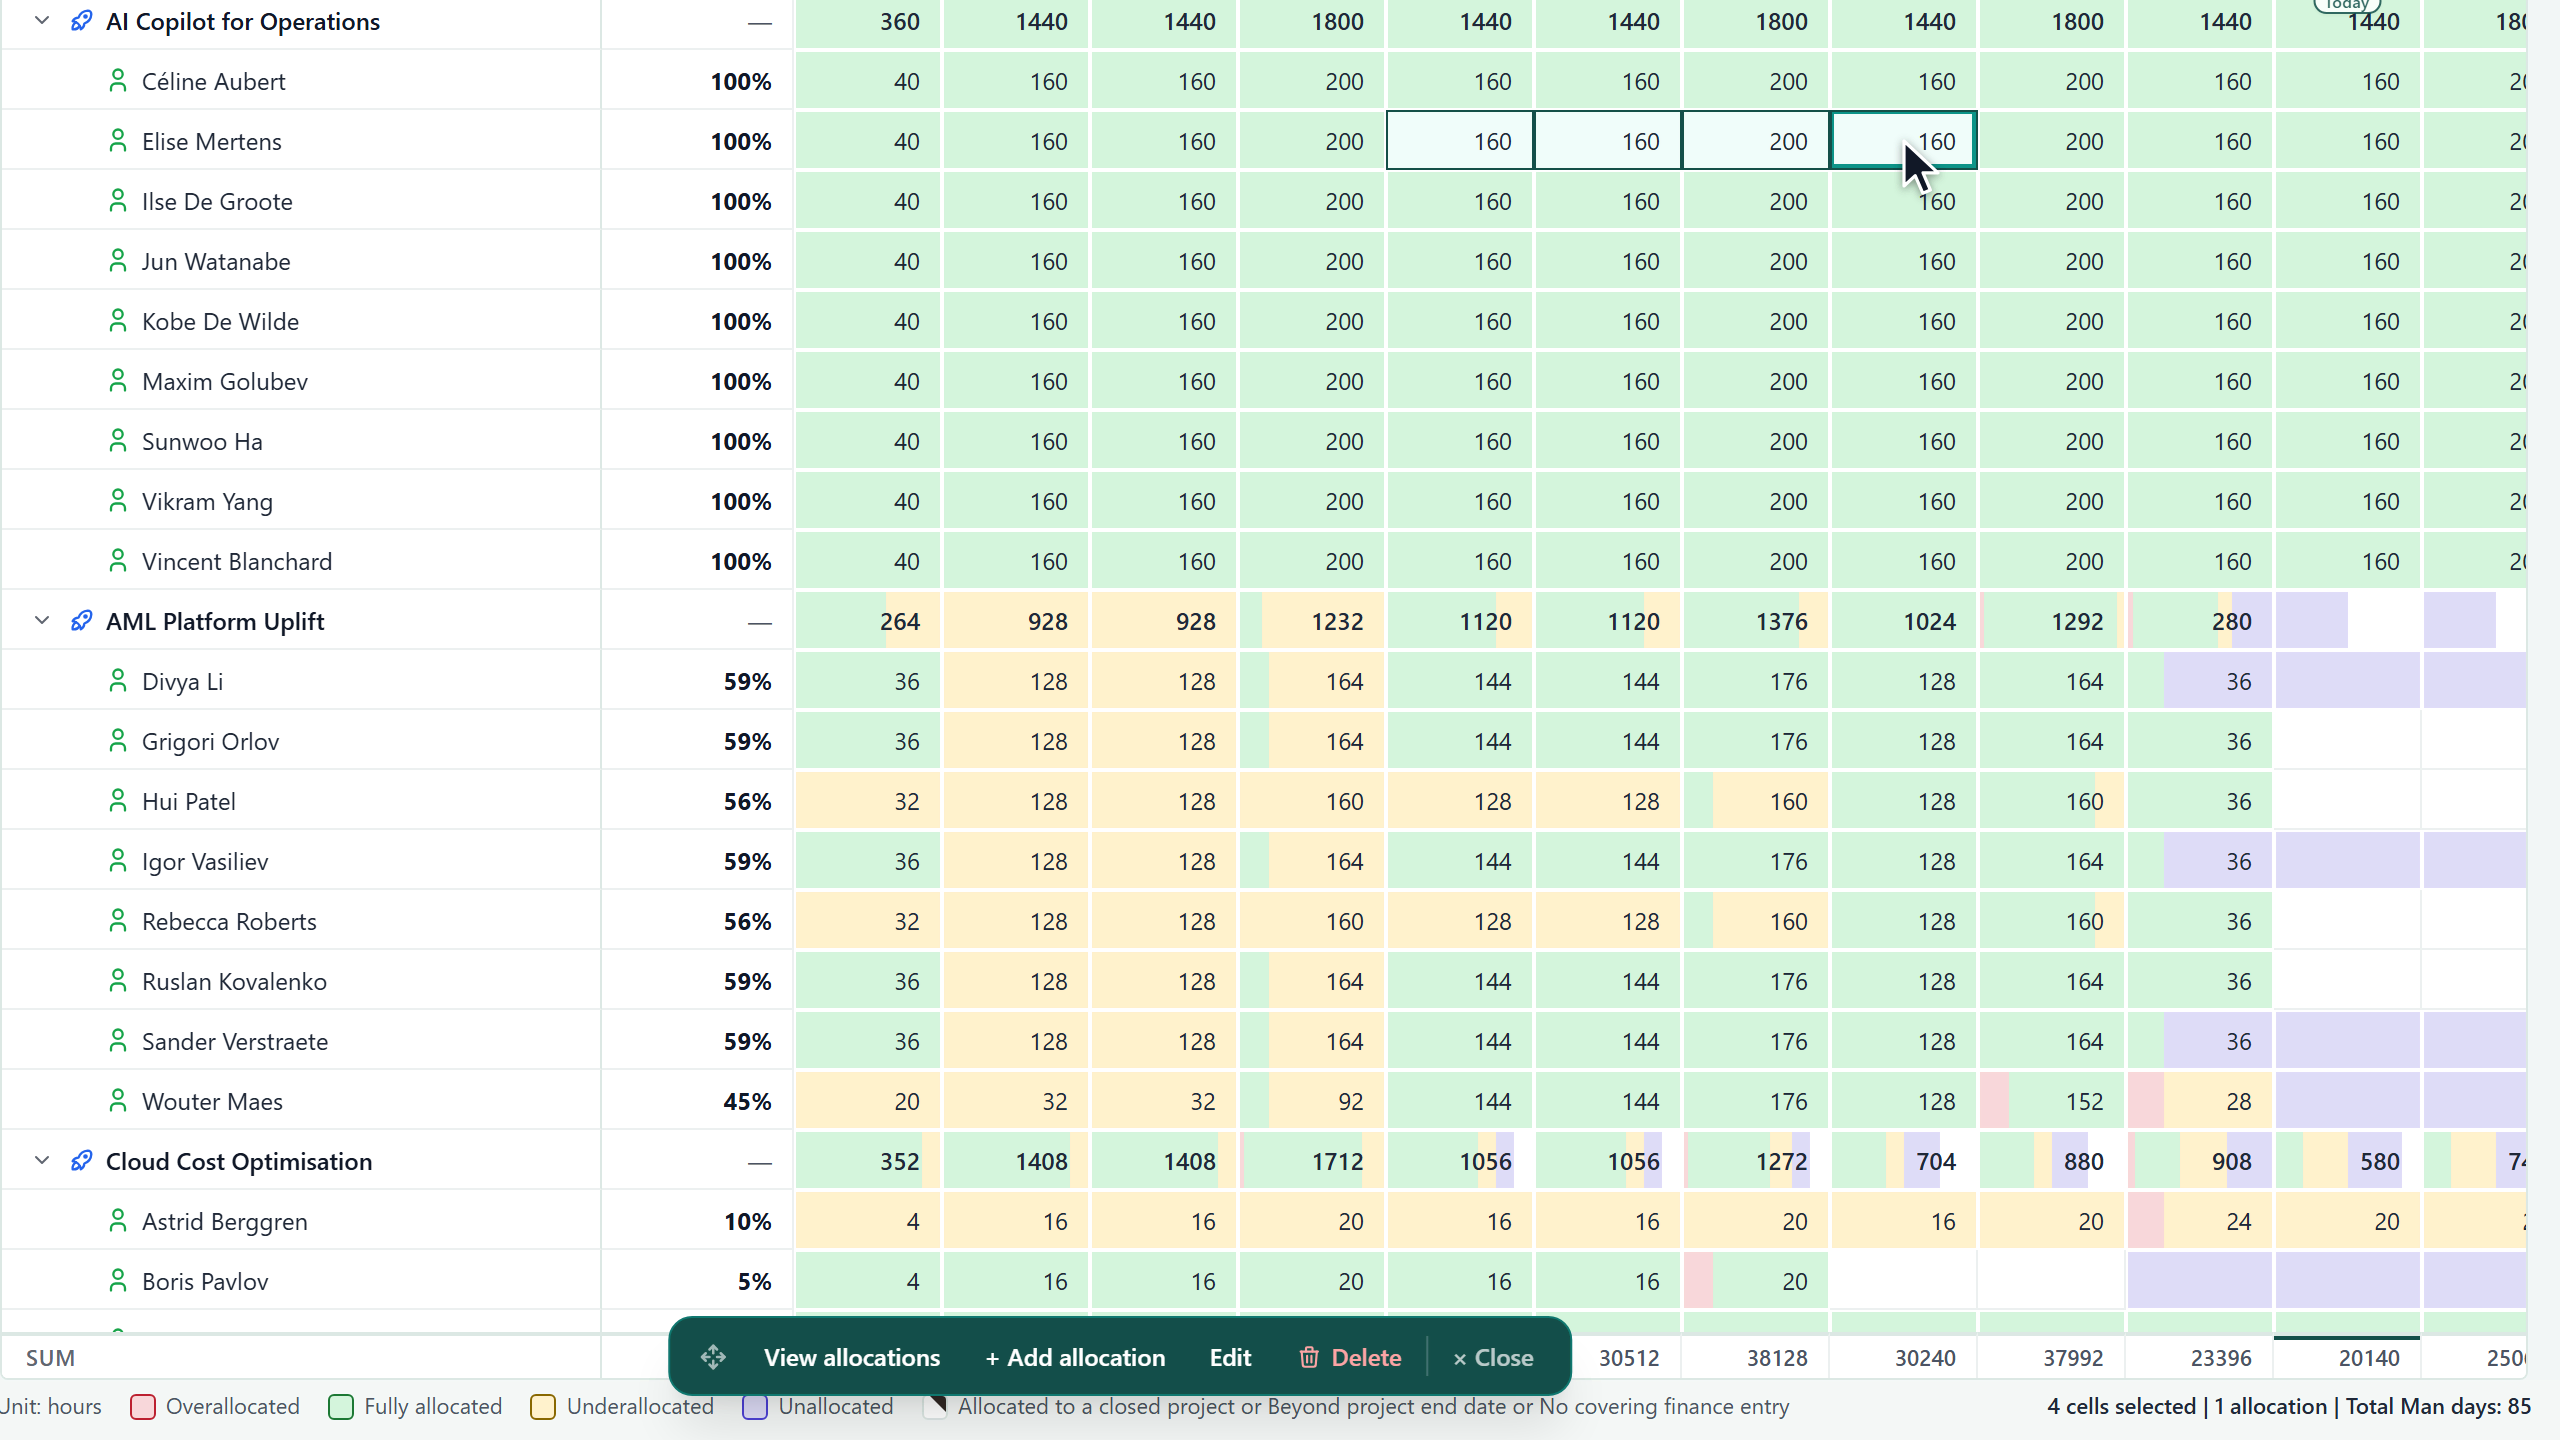
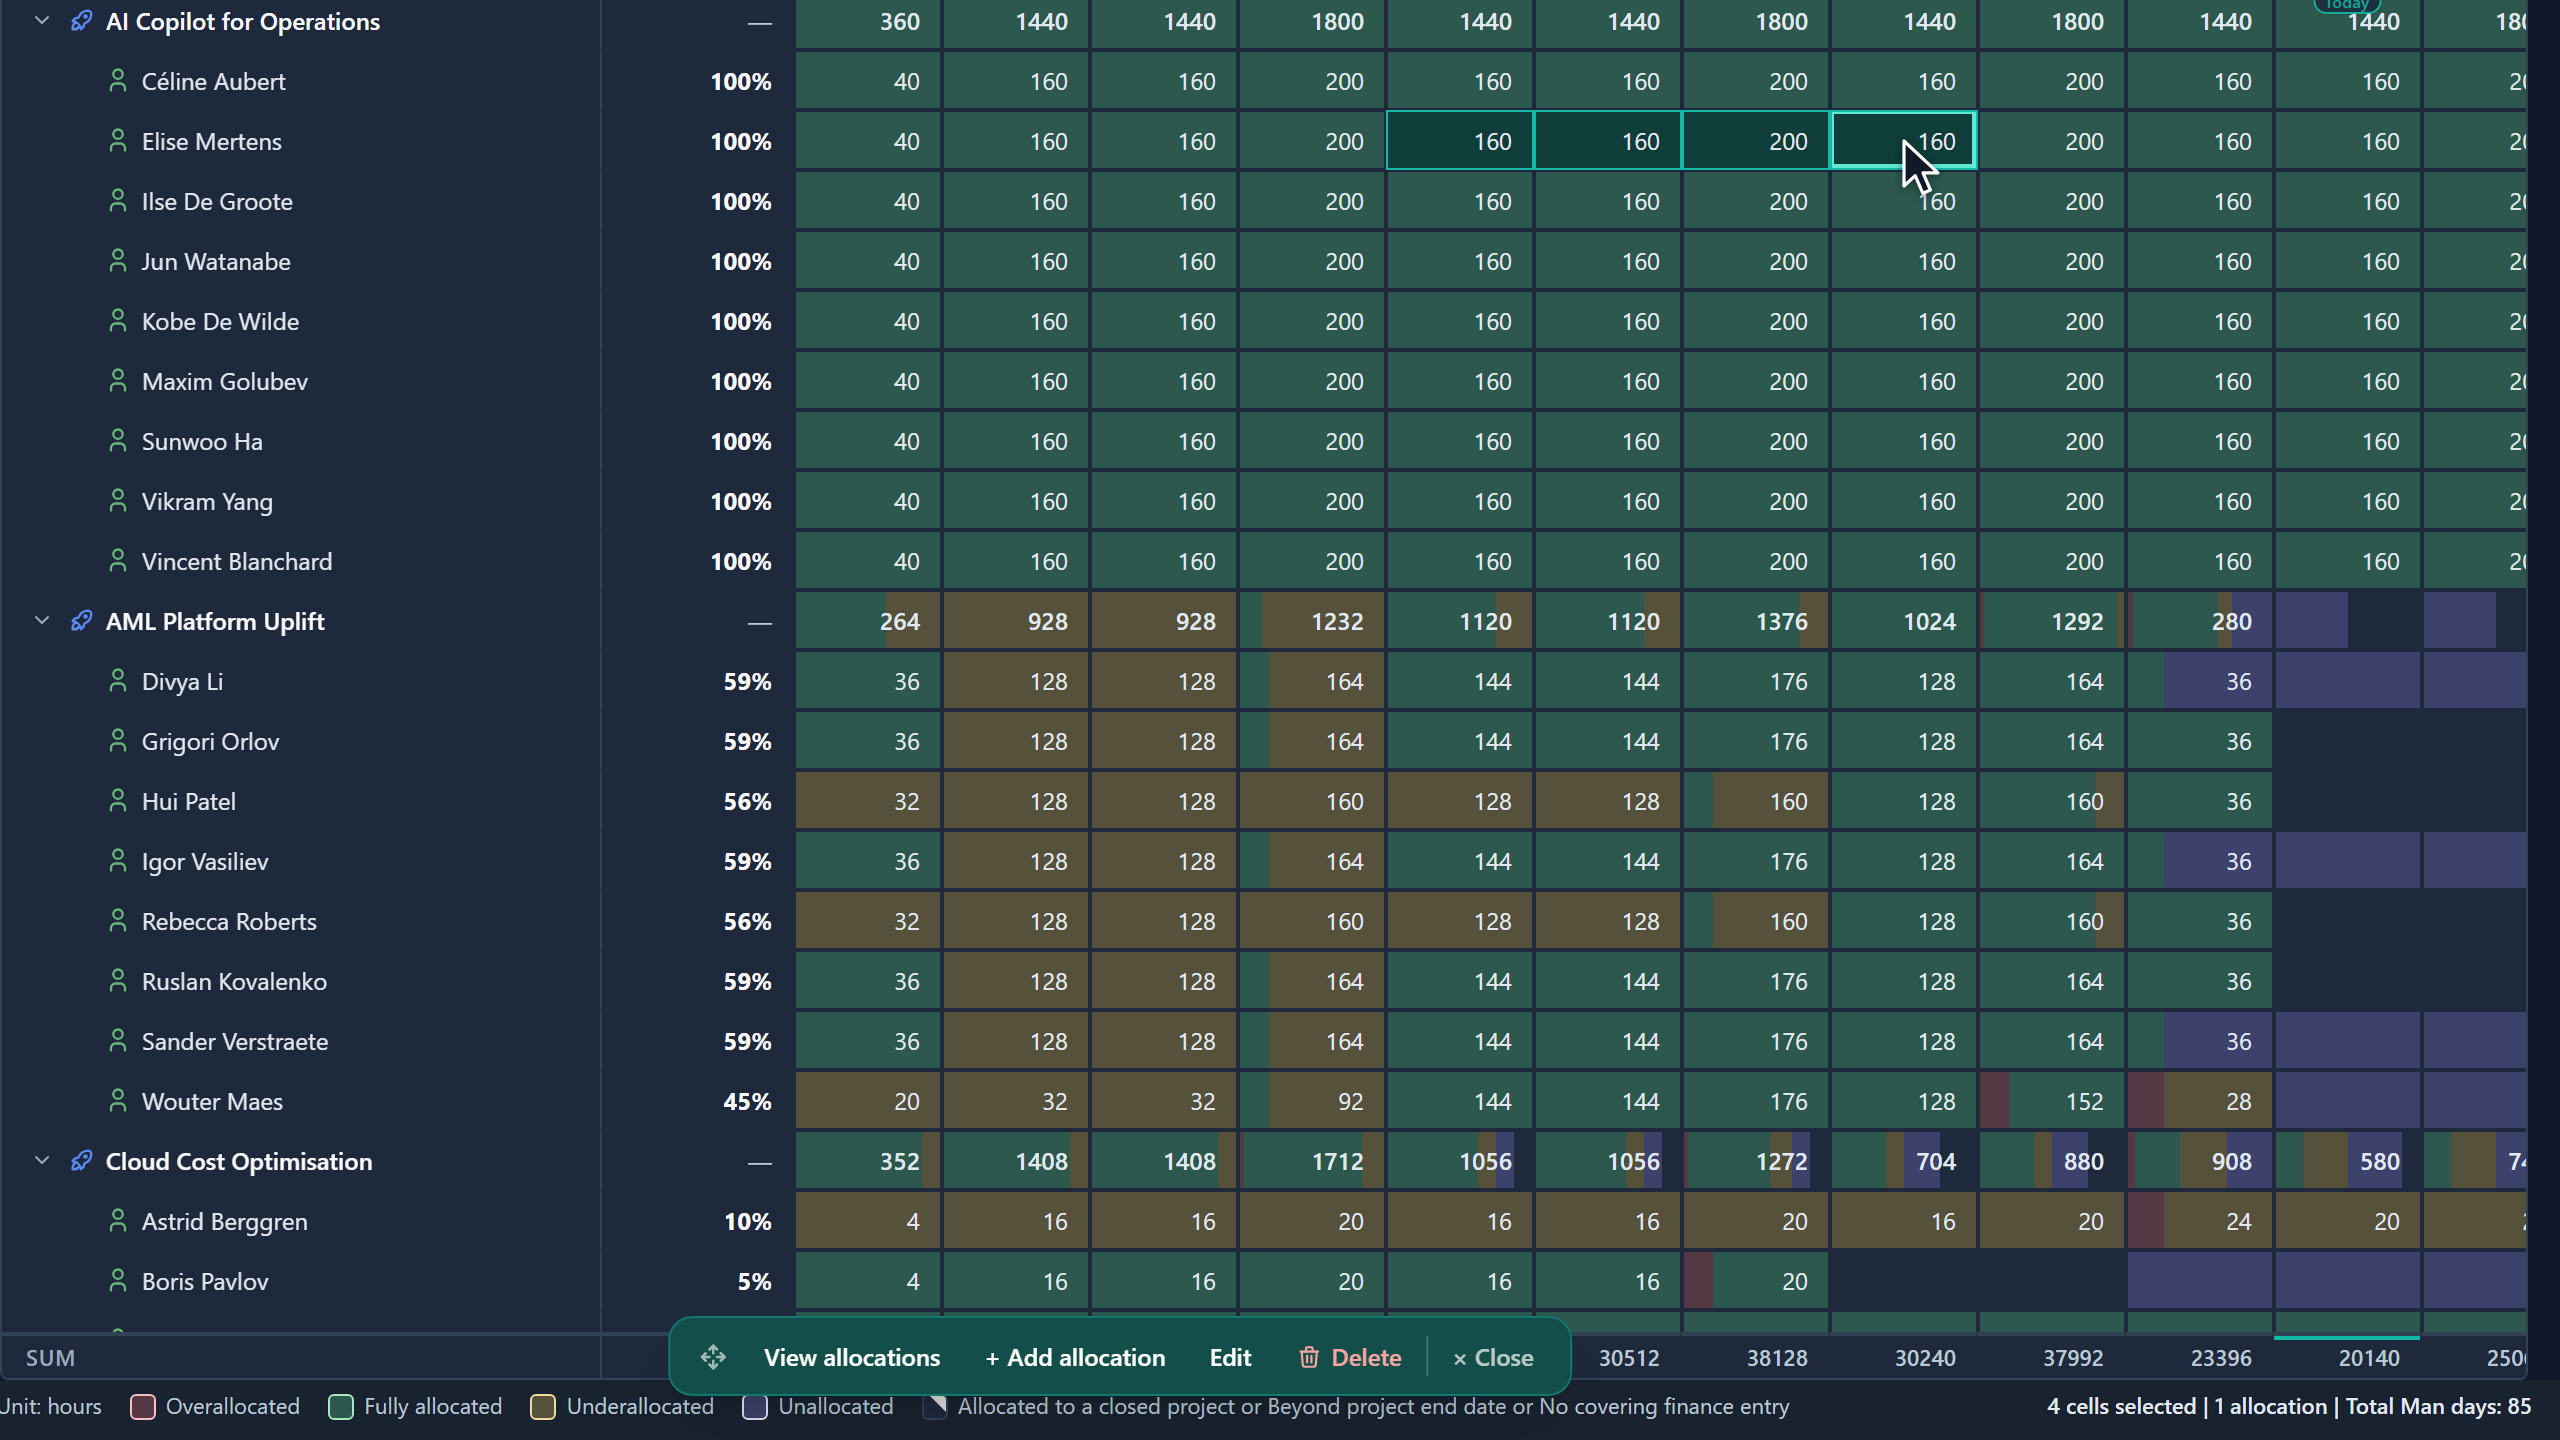
Selecting a group row selects everything under it. Empty cells can be selected too. The legend band shows how many cells and allocations you have selected, and their total. The bar offers:
| Action | What it does |
|---|---|
| Add allocation | Opens the Add dialog filled in from your selection. |
| View allocations | Lists the allocations in the selection. |
| Edit | Opens Edit allocations: change the value, role or scenario of several allocations in one grid. Use Set all and Fill to apply one value to every row. |
| Delete | Opens Delete allocations, where you mark the rows to remove. |
| Reduce overallocation | Shown when someone selected is over-booked. Shrinks the selected allocations, in proportion to their hours, until each over-booked person is back to fully allocated. |
| Increase to full allocation | Shown when someone selected is under-booked. Grows them in proportion until each under-booked person is fully allocated. |
| Add unallocated time | Shown when the selection includes (Unallocated) cells. Books the free time shown on selected (Unallocated) cells. You choose the project. |
Edits, deletes, Reduce and Increase always show a Review changes step with every before and after value. Nothing is saved until you confirm.
Use the Edit allocations grid
The Edit allocations grid has one row per period of an allocation.
- Type in Search these allocations to narrow the rows. A count beside it reads, for example, "12 of 40 periods · 6 allocation(s)".
- Enter a value in Set all and click Fill (or press Enter) to put it on every unlocked row. Set all matching does the same for only the rows the search leaves.
- In the role, scenario and extra-field columns, the placeholder "keep" (shown with dashes) leaves the current value as it is.
- Click Exclude to leave every row alone, or Exclude this row on one row. An excluded row gets no inline edit, no Set all and no deletion.
- Before you confirm, a note reads "This will change N allocation(s). Nothing is written until you confirm."
In the Reduce and Increase reviews, each allocation shows Before, After and Cleared. If someone is still over or under capacity afterwards, a note says how much remains and for which period.
Use the fill handle
In the List, copy booked hours into neighbouring cells the way you would in a spreadsheet.
- Select the cells that hold the value to copy. The selection must be one block.
- Drag the small handle at the bottom-right corner of the selection across or down. A drag moves along one direction only.
- Release the mouse button. The values are written and the selection grows to cover the filled cells, so a second drag continues from there.
Press Esc while dragging to cancel.
A pattern in the selection repeats along the drag. A target cell takes the source cell's total, spread evenly over its own days or weeks, and an empty source clears the target.
If some target cells are on closed projects, Gembaa asks you to confirm with Book anyway.
Delete an allocation
- In the List, open Row actions on the allocation's row and choose Delete.
- In the Delete allocation dialog, read the question. It names the staff member, project, role and scenario, and says how many days or weeks it clears.
- Click Delete to confirm. The allocation leaves the grid.
To delete many, select cells and click Delete in the bar.
Filter allocations
Click Filter. The dialog has these tabs:
| Tab | What it filters on |
|---|---|
| The allocation | Role, Scenario, Capacity and any extra fields. |
| Staff, Team, Project, Program | That record's own fields. |
| Skills | Staff at a given skill level. Not shown while Skills is off. |
Use Search a field across all tabs… to find a field quickly. Rules from every tab apply together. Filters belong to the current allocation tab. See Filter, sort and group.
If nothing matches, the page offers Clear filters or Show all dates.
Save as a tab
Each saved tab remembers its grouping, time period, unit, date range, highlights, filters and sort. Create, rename, duplicate, reorder and delete tabs as described in Create and manage tabs. An admin can set the starting setup of the All tab in the preset settings.
Export allocations
Click Download and choose:
- CSV: data only, one line per allocation.
- Excel: the same, with numeric hours.
- PowerPoint: slides of the current view.
- Image (PNG): the chart only. It is offered when a chart is showing.
Good to know
- The date range limits what you see and what loads. A booking outside the range is still there.
- Switching the capture mode in settings re-buckets every existing allocation. Weekly to daily splits each week into whole hours and puts the remainder on the person's first working day with room. Read the confirmation carefully before you accept it.
- A cell accepts a number of 0 or more, up to 100,000 hours per day or week. Otherwise the cell shows "Enter a number of 0 or more." or "Too large, the maximum is 100,000 hours" with the unit.
- The fill handle appears whatever your access. It writes allocations, so it needs the same Edit access as typing a value into a cell, and the save is refused without it.
- A CSV import refuses rows for a person who has allocation turned off or is deactivated. The row is reported as an issue on the Staff column.
- Only an admin changes the calendar, scenarios, closed-project status and extra allocation fields. See Allocation settings.
- Roles on allocations are the job roles from Roles.
- If an admin switches Skills off, Allocation hides its role column, role grouping, the Role picker, the role column in exports and the Skills tab in Filter. No data is deleted.
- If an admin switches Finance off, Allocation hides the Cost unit and the No finance entry flag. Capacity then comes from the working week in Allocation settings for every person.
- Admins switch these on Administration → Features. See Turn features on or off.