
Gantt
- Purpose
- See Programs, Projects, Tasks, Sub-tasks and Milestones as bars on one timeline, and reschedule by dragging.
- Who is this for
- Everyone
- Prerequisites
- Records with start and end (or due) dates.
- Permissions
- View access to the records. Dragging a bar changes dates, so you also need edit access to that record.
The Gantt page shows your whole delivery tree on one shared timeline: Programs, their Projects, Tasks, Sub-tasks and Milestones. Use it to see where the schedule stands across everything, spot conflicts and move dates by dragging. Your workspace may use different names for these levels.
How it works
The page is split into a table on the left and a timeline on the right. Each record is one row. Rows with children have a chevron, so you can open a Program to see its Projects, a Project to see its Tasks, and so on.
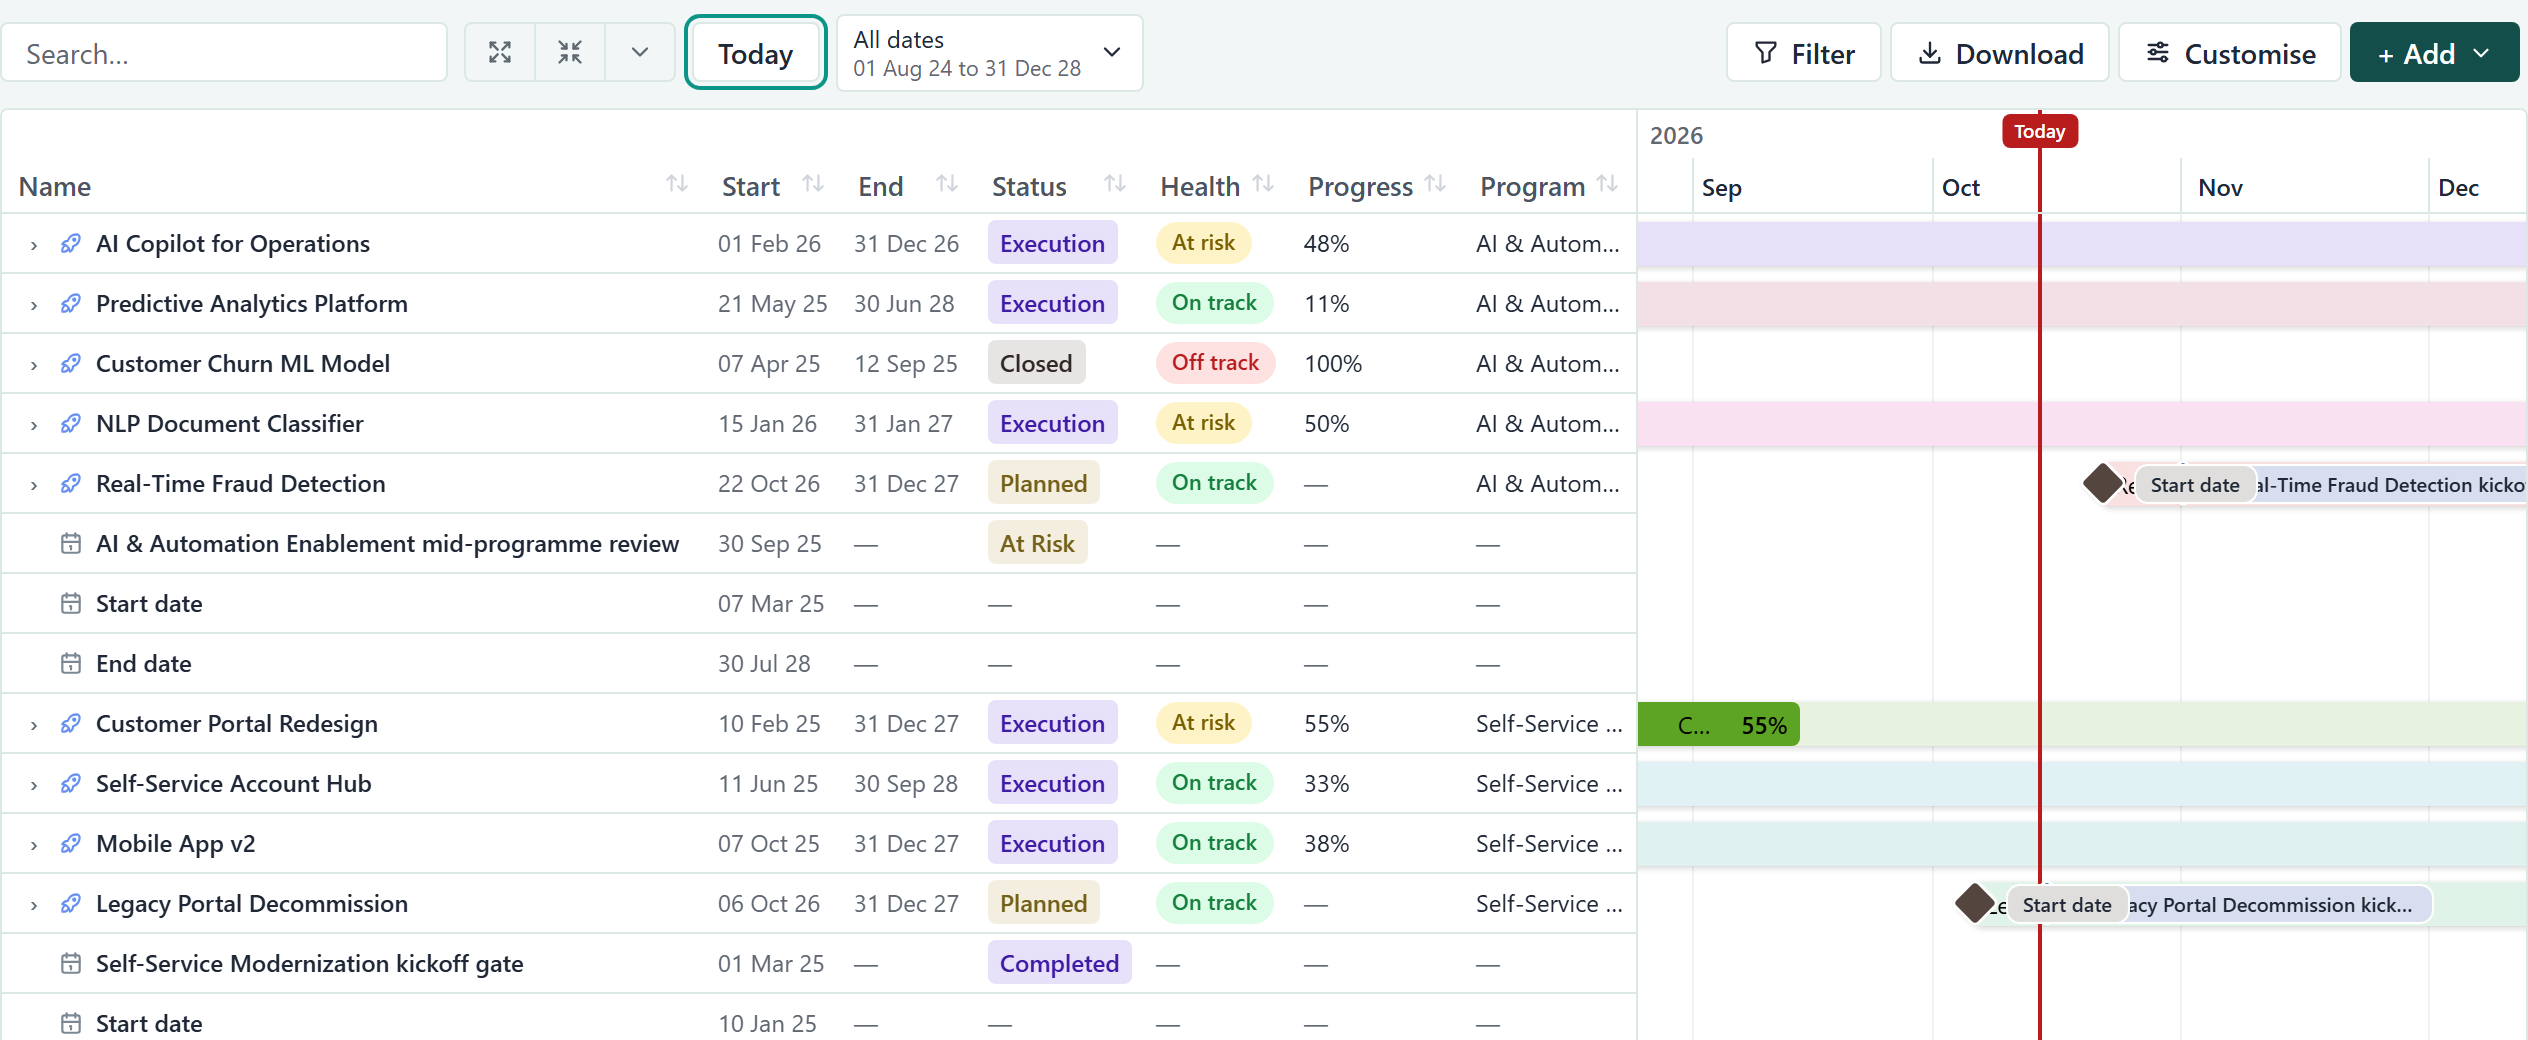
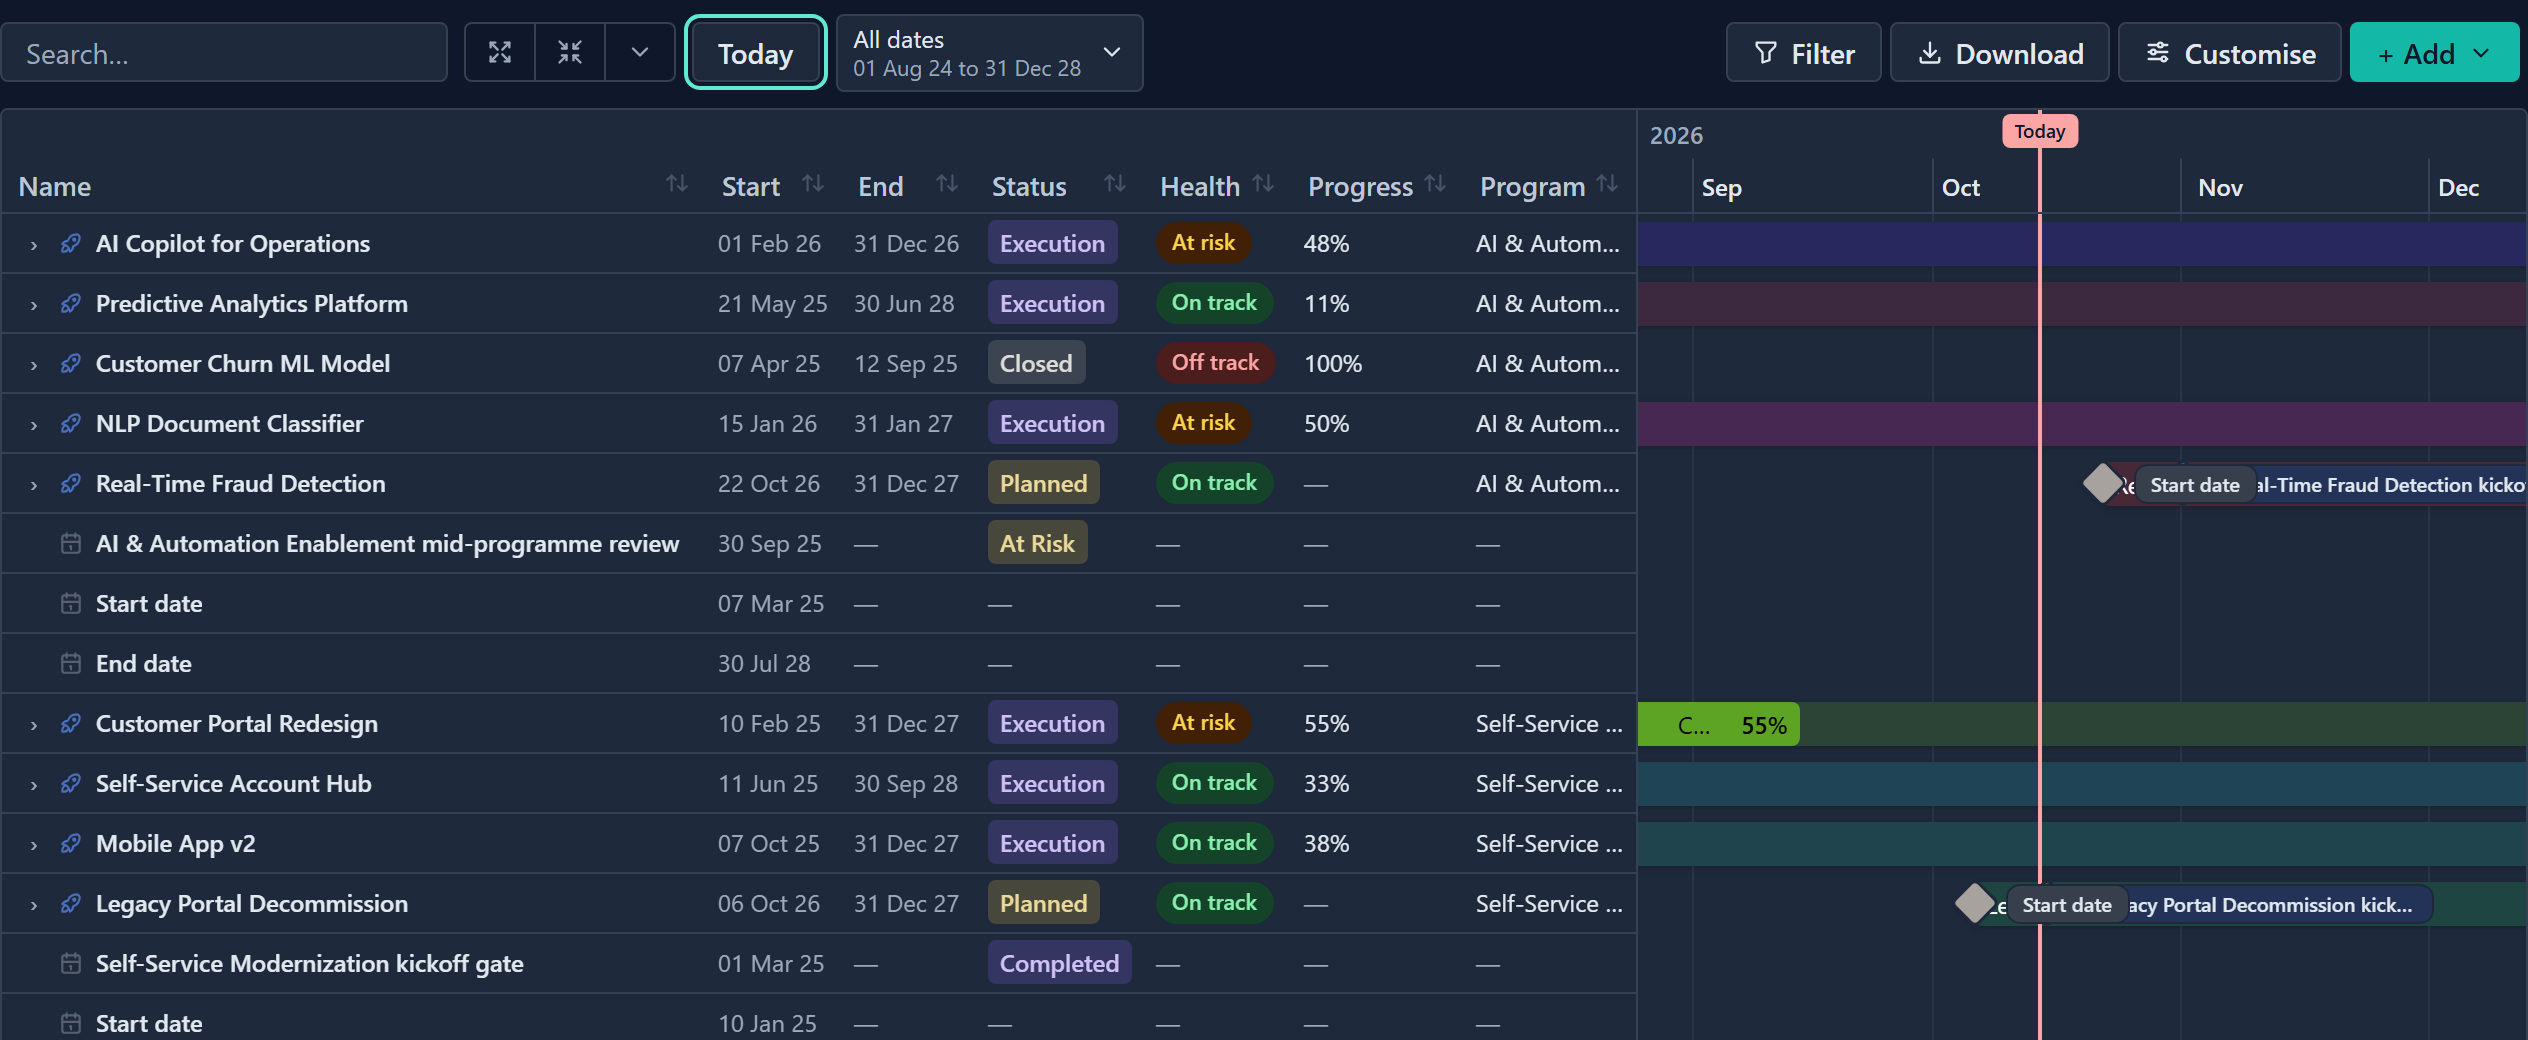
| Part | What it shows |
|---|---|
| Left table | Name, ID, Start, End and Status by default. You can add more columns. |
| Bar | The dates in the record's Start and End columns. The bar colour comes from the record's status. |
| Progress fill | A darker portion of the bar showing the completion percentage, when the record has a progress field. |
| Diamond | A Milestone. Its colour comes from the milestone's Category. |
| Today line | A vertical red line with a Today label. |
Records with no dates keep their row in the table but have no bar.
Hover a bar to see its name, start, end, duration, status and completion. Hover a milestone to see its name, target date, category and status.
Saved tabs on this page work like tabs elsewhere in Gembaa. Scale, filters, columns and the other settings below are saved per tab. See Create and manage tabs.
Change time scale
- Open Customise in the toolbar.
- In the panel's Gantt tab, choose a value in Timeline format: Days, Weeks, Months, Quarters or Years. The chart rescales at once.
- Optional: Click Today in the toolbar to scroll back to today's date.
The default is Months. On the Weeks scale each column shows the week number and the date of its Monday.
The panel has a Table tab and a Gantt tab. They are panel tabs, not saved tabs. In Gantt only mode the Table tab is greyed out, and in Table only mode the Gantt tab is. Hover a greyed tab to read Not available in Gantt only mode or Not available in Table only mode.
Expand and collapse rows
Click the chevron on a row to open or close it. The toolbar also has buttons to expand all rows, collapse all rows, and a drop-down to open the tree down to Level 1 (Programs), Level 2 (Projects), Level 3 (Tasks) or Level 4 (Sub-tasks). Your expanded rows are remembered per tab.
Reschedule by dragging
To move a record, drag its bar:
- Hover over the bar until the cursor changes.
- Drag the body of the bar to move both dates by the same amount. The duration stays the same.
- Release. The new dates save straight away, and a small bubble confirms Saved.
To change only one date, drag an edge of the bar instead:
- Hover over the left edge of the bar to change the start date, or the right edge to change the end date.
- Drag the edge to the new date.
- Release. The new date saves straight away.
While you drag, a label follows the cursor with the new date. Dates snap to whole days. If the start would pass the end, or the bar would shrink to zero days, the bar returns to where it was.
To change progress, drag the thin handle at the edge of the filled portion. A Complete percentage follows the cursor and saves when you release.
Milestones can be dragged too. A milestone has one date, so there is nothing to resize. Dragging a milestone never moves the bar it sits on, and dragging a bar never moves its milestones.
Spot date conflicts
When any child falls outside its parent's dates, an amber warning icon appears next to the parent's name. Hover it to read the explanation. The icon shows even when the parent is collapsed, and it disappears as soon as every child fits.
It is a warning only. Gembaa does not block the change, and a Program's bar does not stretch to fit its children.
Link arrows have their own conflict signs, described under Show links as arrows.
Filter and search
- Click Filter in the toolbar. The dialog has one tab per level (Program, Project, Task, Sub-task, Milestone).
- Set an operator and a value on any field. Use Show all to list every field, or the search box to find one.
- Click Apply. The button shows how many filters are active.
Filters on each level work like this:
- A level with no filters keeps all its rows, as long as their parent survives. A filter on Program alone keeps every Project, Task and Sub-task under each matching Program.
- A row that fails its own level's filter disappears together with everything under it.
- A row that passes its own level's filter stays, even if nothing below it matches.
- A level with no filters stays only when a matching row sits below it. A filter on Task Status alone narrows Programs and Projects to the ones that contain a matching Task.
Filters read the whole tree, so they work even on collapsed rows. A parent whose children were all filtered out keeps its chevron and shows No child items match your filters when opened.
For general filter behaviour, see Filter, sort and group.
Search rows
Type in the search box in the toolbar. It matches row names and highlights the match.
Narrow by period
- Click the date range picker in the toolbar.
- Choose a preset: This month, This quarter, Next 3 months, Next year or All dates. The chart narrows to that period.
To use your own period, set a start and an end in the picker instead. The picker's second line shows the exact range.
Rows whose bars fall outside the range are hidden, and bars that cross the edge are clipped.
If nothing is left to show, the page says No items match your filters, with Clear filters.
Customise the page
Click Customise to open the side panel. Changes apply at once.
Above the tabs:
| Setting | What it does |
|---|---|
| Visualisation | Table + Gantt, Table only or Gantt only. In Gantt only mode the chevrons move onto the timeline. |
| Visible levels | Choose which levels appear as rows. If you hide a level, its children appear directly under the nearest visible parent. |
| Visible milestones | Choose which levels show their milestones. It appears only when your workspace has milestones on the Gantt. |
| Sort | Column sort (click a column header) or Manual order (drag rows within their level, with Reset order to undo). |
The Table tab of the panel controls the left table:
| Setting | What it does |
|---|---|
| Columns | Drag a column by its handle to reorder it, or use the eye icon to hide or show it. To reorder with the keyboard, see Reordering lists. |
| Name | Always visible. |
| Start and End | A lock icon marks them, and hovering it gives the reason. You can hide them but not delete them, because they place the bars. See Change bar fields. |
| ID | Shows each record's ID. It is read-only and has no field-mapping gear. A tab saved before the ID existed may hide it, so show it here. |
| Add column | Builds a custom column. See Add a custom column. |
| Highlights | Colours rows by rule. |
The Gantt tab of the panel has the Links control, the Swimlanes settings and, under Gantt chart configuration, these switches:
| Switch | What it shows |
|---|---|
| Show today's marker | The Today line. |
| Show milestone diamonds in bars | Diamonds on the bars they belong to. |
| Show milestone names in bars | The milestone's name beside its diamond. |
| Show date-field milestones | Milestones that mirror a date field on a record. |
| Show progress in bar | The darker progress fill. |
| Show milestone legend | A strip under the chart listing the milestone categories on screen. |
The Links control sets which link arrows the chart draws. See Show links as arrows.
Edit table values
- Double-click a cell in the left table. The cell turns into an input.
- Type the new value.
- Press Enter or Tab to save, or Esc to cancel. The change saves to the record straight away.
A single click on a row's name opens its record panel instead. A Milestone's End cell and cells that show a calculated (formula) field are read-only. A custom column cell is also read-only on a level where the column has no field mapped.
Change column width
- Drag the right edge of a column header in the left table to resize the column.
- Double-click that edge to fit the column to its header and its longest value.
The first time you open a view with no saved widths, Gembaa fits every column for you. That fit is not a change to the tab, and saved widths always win.
Add a custom column
A custom column reads a different field on each level, so one column can show Budget on Projects and Cost on Tasks.
- Open Customise and go to the Table tab.
- Click Add column. The Add column dialog opens.
- Enter a Column name, for example Budget.
- Choose a Column type: Text, Rich text, Number, Progress, Date, Select, Multi-select, Status, Priority, Checkbox or Relation.
- Under Field mapping per level, choose the field each level should show.
- Click Add. The column appears in the left table.
Leave a level on its "None" option to keep its cells blank. A level says No compatible fields when none of its fields match the column type.
To change or remove a column later:
- On the Table tab, click the gear on the column's pill (Configure field mapping).
- Change the name, type or mapping, and click Save. The column updates in the left table.
Changing the type clears the mapping, so choose the fields again. To remove the column instead, click Delete column in the same dialog.
Change bar fields
By default, Start reads Start date, End reads End date on Programs and Projects and Due date on Tasks and Sub-tasks, and Status reads Status. A Milestone uses its Date. If an admin renames one of these fields, the column stays linked to it. You can point any of the three columns at a different field on each level, for example another date field on Projects.
- Open Customise and go to the Table tab.
- Click the gear on the Start, End or Status row (Configure field mapping).
- Under Field mapping per level, choose the field for each level you want to change.
- Click Save.
The new field drives everything that uses the column: the cells, the bars, dragging a bar (which writes to the mapped fields), highlights and the downloads from this page. A Status mapping changes the Status cell and its colour.
- Start and End accept date fields only, so their type cannot be changed.
- A level you leave alone keeps its default field, and the dialog shows that field selected. If a mapped field is later deleted, the level goes back to its default.
- If a record's mapped field is empty, the record has no date in that column and no bar. The Gantt does not fall back to the default field.
- A Milestone you add on the Gantt places its diamond by the Start mapping on the Milestone level. A milestone that mirrors a date field always uses that mirrored date.
- A Milestone has one date and no End. In the End column's dialog the Milestone picker reads Not used, with a lock beside it. It is greyed out and opens nothing. Hover it to read the reason: "A milestone has a single date and no end date. Its diamond is placed by the Start column."
- A stale saved End mapping for Milestones is ignored.
- Status can be deleted with Delete column.
- In the Start and End dialogs, Delete column is greyed out. Hover or focus it to read why: the Gantt uses Start and End for its bars, and Start for milestones, so these columns cannot be deleted.
- The Gantt slide in a PowerPoint deck is not tied to a tab, so it always uses the default fields.
Group into swimlanes
- Open Customise and go to the Gantt tab.
- Choose a field under Swimlanes. Select, status, priority, relation, text and checkbox fields are offered. A tinted strip appears down the left of the timeline with each band's name.
- Optional: Drag the bands under Swimlanes order to reorder them.
- Optional: Click a band's swatch to recolour it.
Every Program keeps its whole subtree in one band. Programs with no value go to an Ungrouped band at the bottom. Choose None to turn swimlanes off.
Show links as arrows
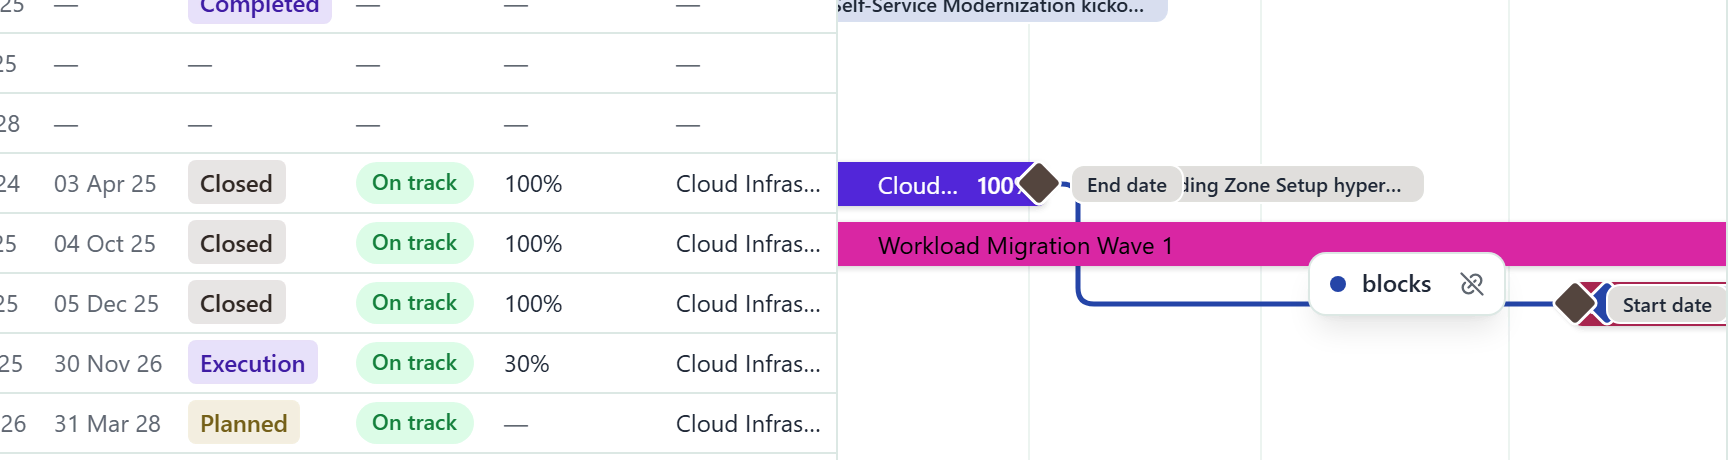
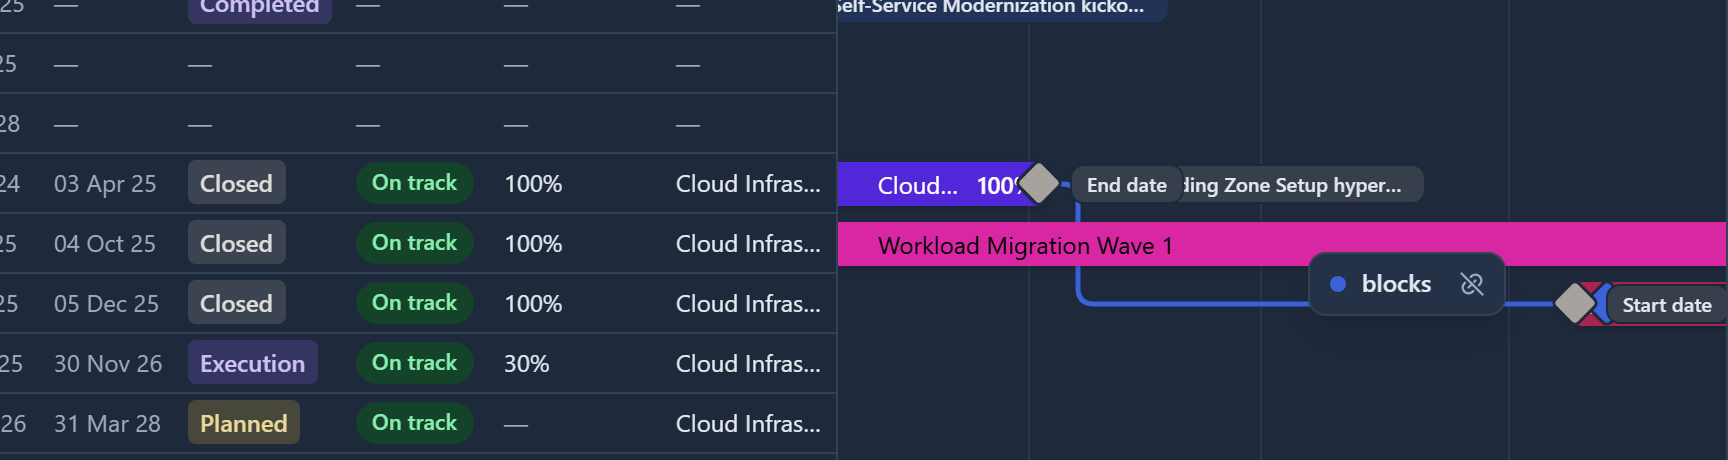
A link joins two records, for example "Task A blocks Task B". The Gantt draws each link as an arrow from the right edge of the source bar to the left edge of the target bar, behind the bars, in the colour of the link type. A milestone links from or to its diamond. For what links are and how to add them from a record, see Link records.
Choose arrows
- Open Customise and go to the Gantt tab.
- Under Links, choose Selected, All or Off. The arrows change at once.
- Selected (the default) draws the arrows of the bar you hover or select, plus every link in conflict.
- All draws every arrow.
- Off hides every arrow.
The setting is saved with the tab like the other Gantt settings. A link whose other end is hidden, for example in a collapsed row, is not drawn. Hovering a row fades the arrows that do not touch it.
Read an arrow
A symmetric link type, such as Relates to, has an arrowhead at both ends. Hover an arrow to open a small card with a dot in the type colour and the link as the source reads it, such as blocks. Rest the pointer on the label to see how the other record reads it. An Admin also sees an Unlink button on the card.
A red arrow means a date conflict: the source ends after the target starts. The card then adds a line such as Dates overlap by 3 days, and the target bar gets a red badge with the tooltip A link into this bar is in date conflict. Only link types that affect the schedule can conflict, and the Gantt does not block the dates. Admins set that option on Link types.
Add a link
Adding a link needs an Admin. Use either way:
- Hover a bar. A round handle appears at each end.
- Drag a handle onto another bar and release. The bar you drag from is the source for the right-hand handle and the target for the left-hand one.
- In the Add link chooser, click a link type. The arrow appears and a toast says Added link.
Releasing on the same bar or on empty space cancels. The first time, a hint says Drag a round handle onto another bar to link them. Drag handles are not available on touch screens.
To add a link without dragging:
- Right-click a row and choose Add link…, or click a bar to select it and press L.
- In the chooser headed From and the record's name, click a link type.
- In the picker headed Add link and the type's label, choose the record to link to. The arrow appears and a toast says Added link.
Remove a link
- Hover the arrow to open its card.
- Click the Unlink button on the card. The arrow goes at once, with no confirmation, and the toast says Removed link with Undo.
You can also press Tab until an arrow has focus and press Delete or Backspace. Press Esc to clear the selected bar or arrow.
While links load
The toolbar shows Loading links… while the arrows load. The bars never wait for them. If loading fails, it shows Links could not be loaded with Retry.
Add, duplicate, recolour and delete
To create a record, click Add in the toolbar and choose Program, Project, Task or Sub-task.
To work on an existing row, right-click it and choose one of these:
| Menu item | What it does |
|---|---|
| Add child | Creates a child under the row, for example Add child Task. |
| Add link… | Starts a link from this row's record. See Show links as arrows. |
| Duplicate | Opens the Add dialog with the row's values filled in. Nothing is created until you click Add. |
| Color | Offers a palette plus Auto (colour by status). |
| Delete | Deletes the row straight away, with no confirmation. |
Download the chart
- Click Download in the toolbar.
- Choose a format: Image (PNG), Image (SVG), or a CSV or Excel file with either all rows or visible rows only. The file downloads to your computer.
Images contain the timeline only, for the rows currently expanded. See Export data for general export behaviour.
Good to know
- A record panel opened from the Gantt cannot delete. Delete is greyed out there, with a tooltip that says to open the record from its own table. The right-click Delete on a row still works.
- When a bar is off screen, hover its row to see an arrow at the edge pointing to it.
- The Gantt link controls (drag handles, Unlink, L) need an Admin. Add link… in the row menu shows to everyone, but adding the link is refused for a Member.
- If two people move the same bar at once, the last save wins.
- Bars narrower than about 40 px hide their percentage label.
- If an admin switches Tasks off on Administration → Features, the Gantt shows Programs and Projects only. See Turn features on or off.