Customize your allocation data display
Customize your allocation data display in the format that works best for you.
📝Overview
Purpose
- Personalize how allocation data is displayed to suit your reporting and analysis needs
- Improve visibility of staff, projects, and costs by using exploring different layouts and visualizations
Who is this for
- PMOs, stakeholders, and managers who want to view allocations in a way that best fits their workflow
Pre‑requisites
- Existing allocations in the platform
- Familiarity with navigating Allocations
Permissions required
- Access and permission to view allocations
📹Demo walkthrough
💭How‑to guide
Customizations are flexible and offer a variety of views such as data grid, tree map, stacked column, charts, and more; the instructions below provide a basic overview of how to use the customize option starting with the data grid.
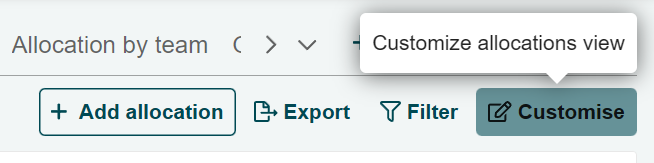
Step 1: Open customize panel
Click the Customize button on the upper right corner to open the panel.
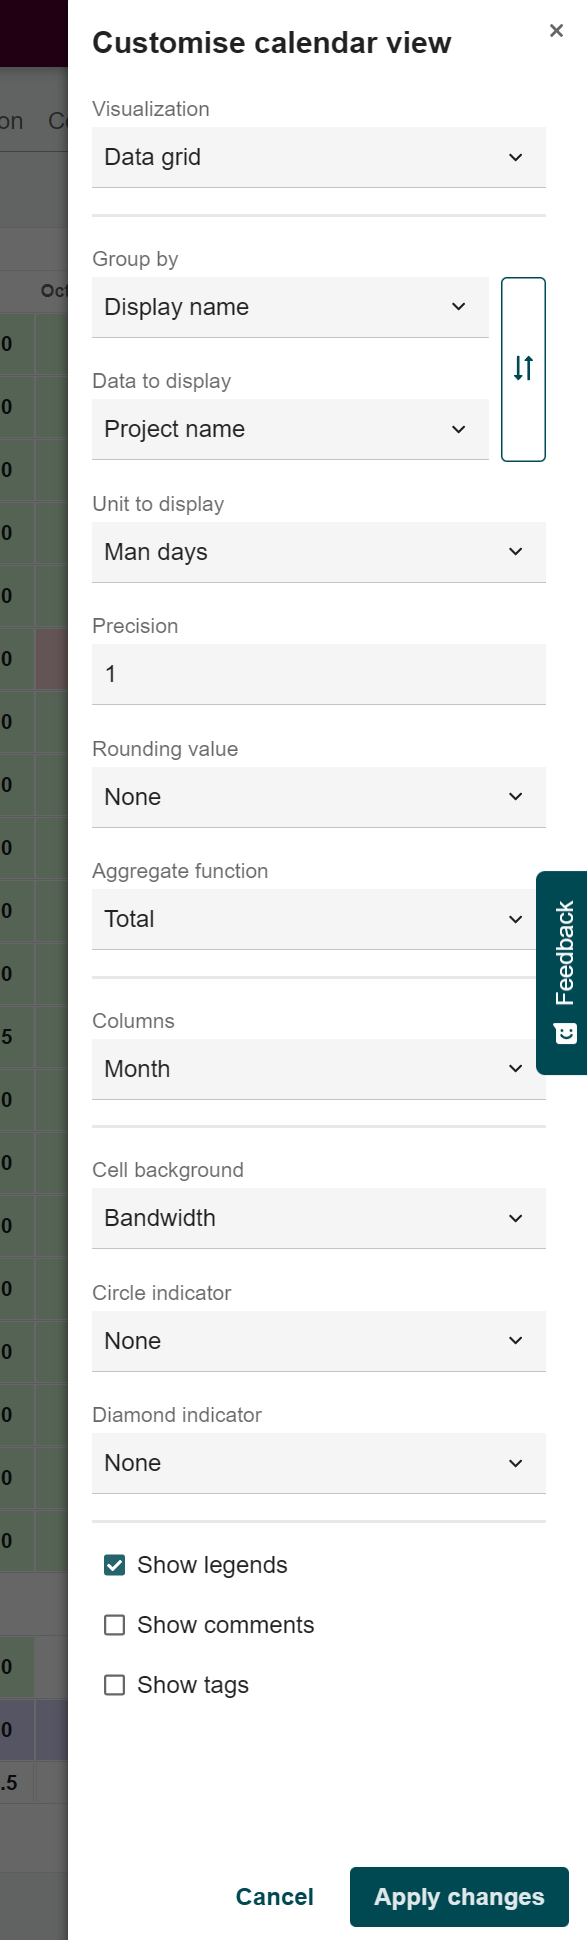
Step 2: Configure your display settings
ℹ️ In this example:
We want to display allocations per staff and their associated projects.
⚠️ Note:
Key items to adjust may vary per visualization type.
As we work on the Data Grid view, key items to adjust are:
- Visualization – type of visual remains Data Grid (Data Grid, Tree Map, etc.)
- Group by – set to Staff Display name to organize allocations by staff
- Data to display – set to Project Display name to see each staff's assignments to the projects they are working on
💡Tip:
Use the arrows on the right side to easily interchange the Group by and Data to display values with a single click
- Unit to display – set to Man days, to see the number of working days
- Columns – set to Month, this defined the granularity of the data view
Step 3: Apply changes
Click on Apply changes and see the updates applied in the chosen visualization.
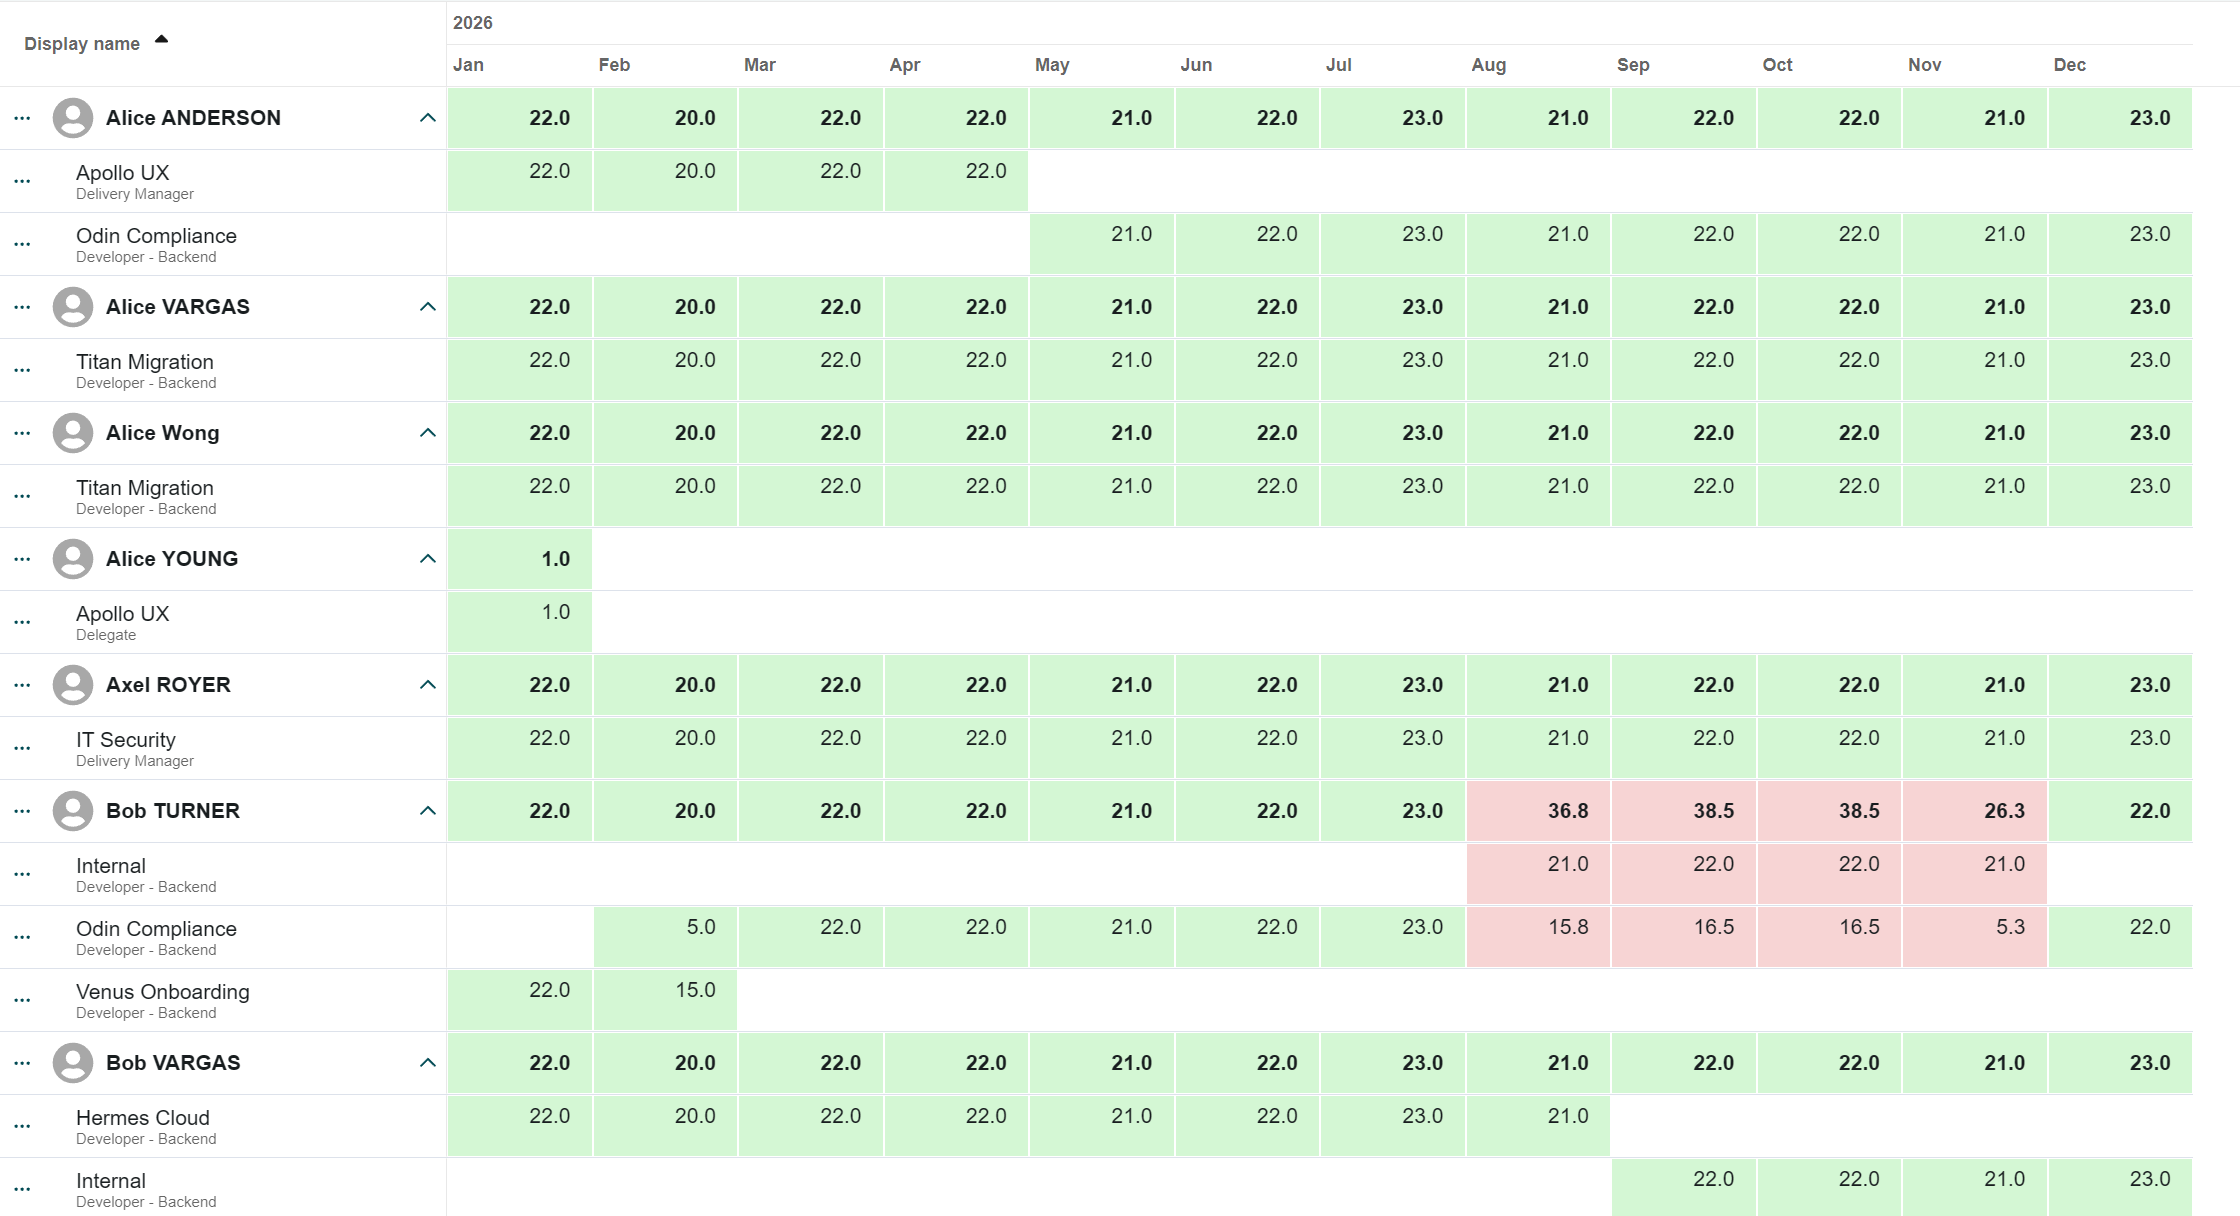
In this example (Data Grid), staff appear first, and expanding a row shows the projects they are allocated to.
Before changes:
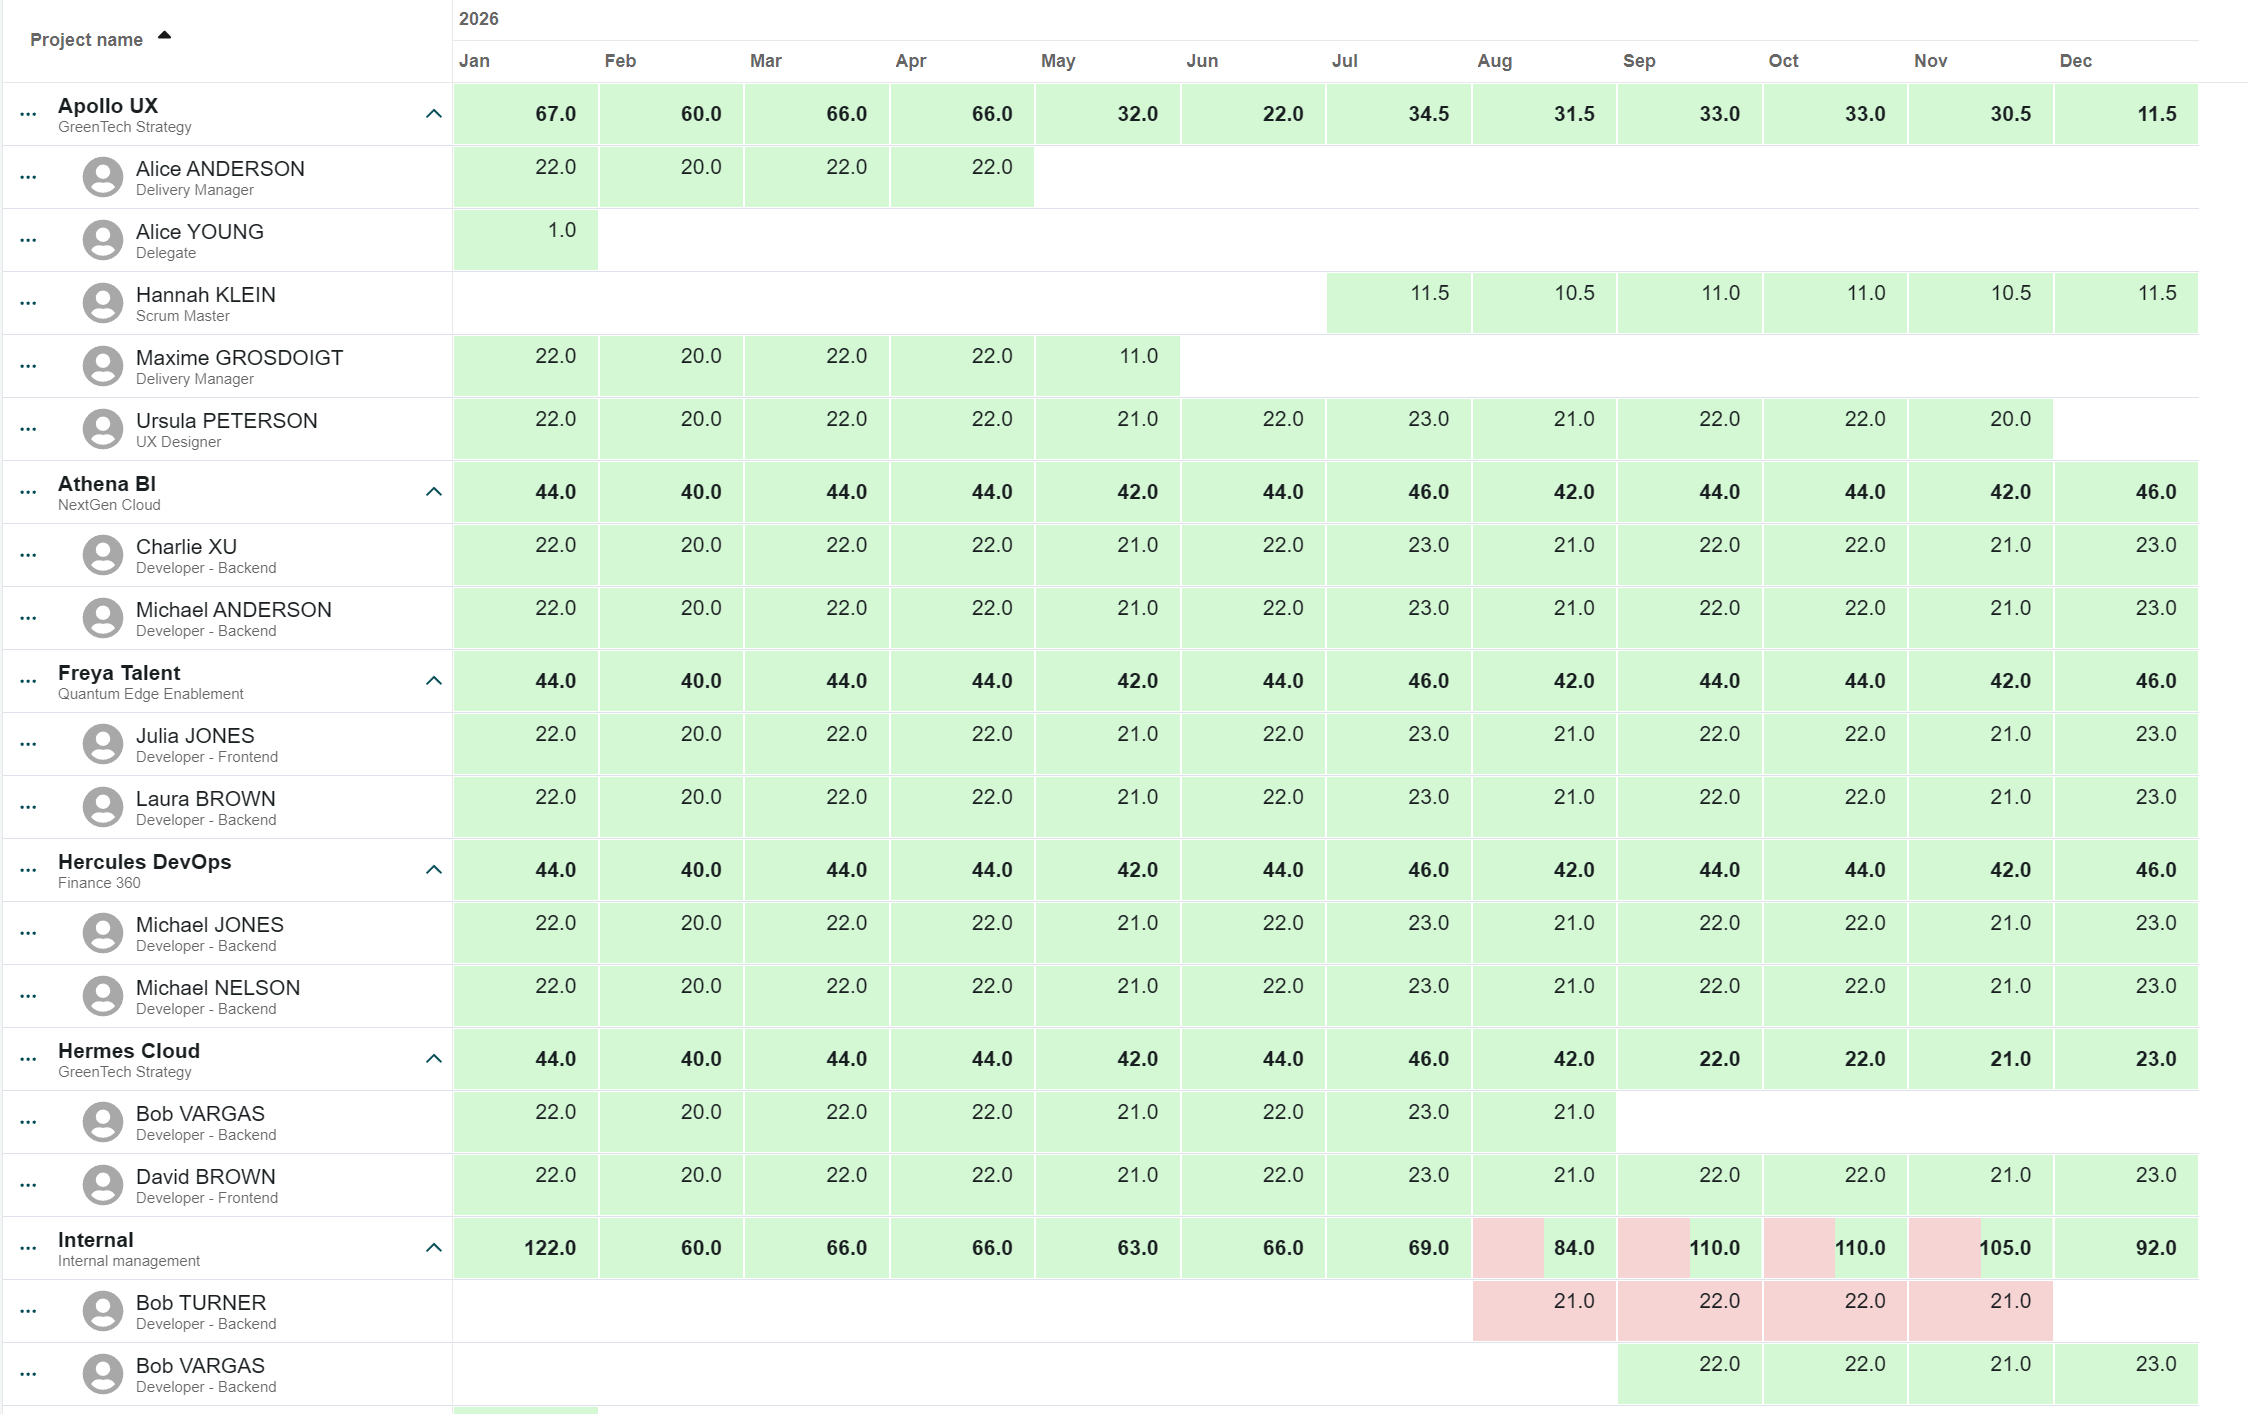
After changes: